
EUR/USD – Bullish Reversal Or A Flash In The Pan?
We mentioned that the Friday session would decide the fate of our short position in EUR/USD. We witnessed a rebound and our positions were automatically (and profitably) closed. What kind of action is warranted, is it time to consider opening a long position or not? What about the Japanese yen and the Canadian dollar?
Let’s jump right into charts.
EUR/USD – Sizable Invalidation
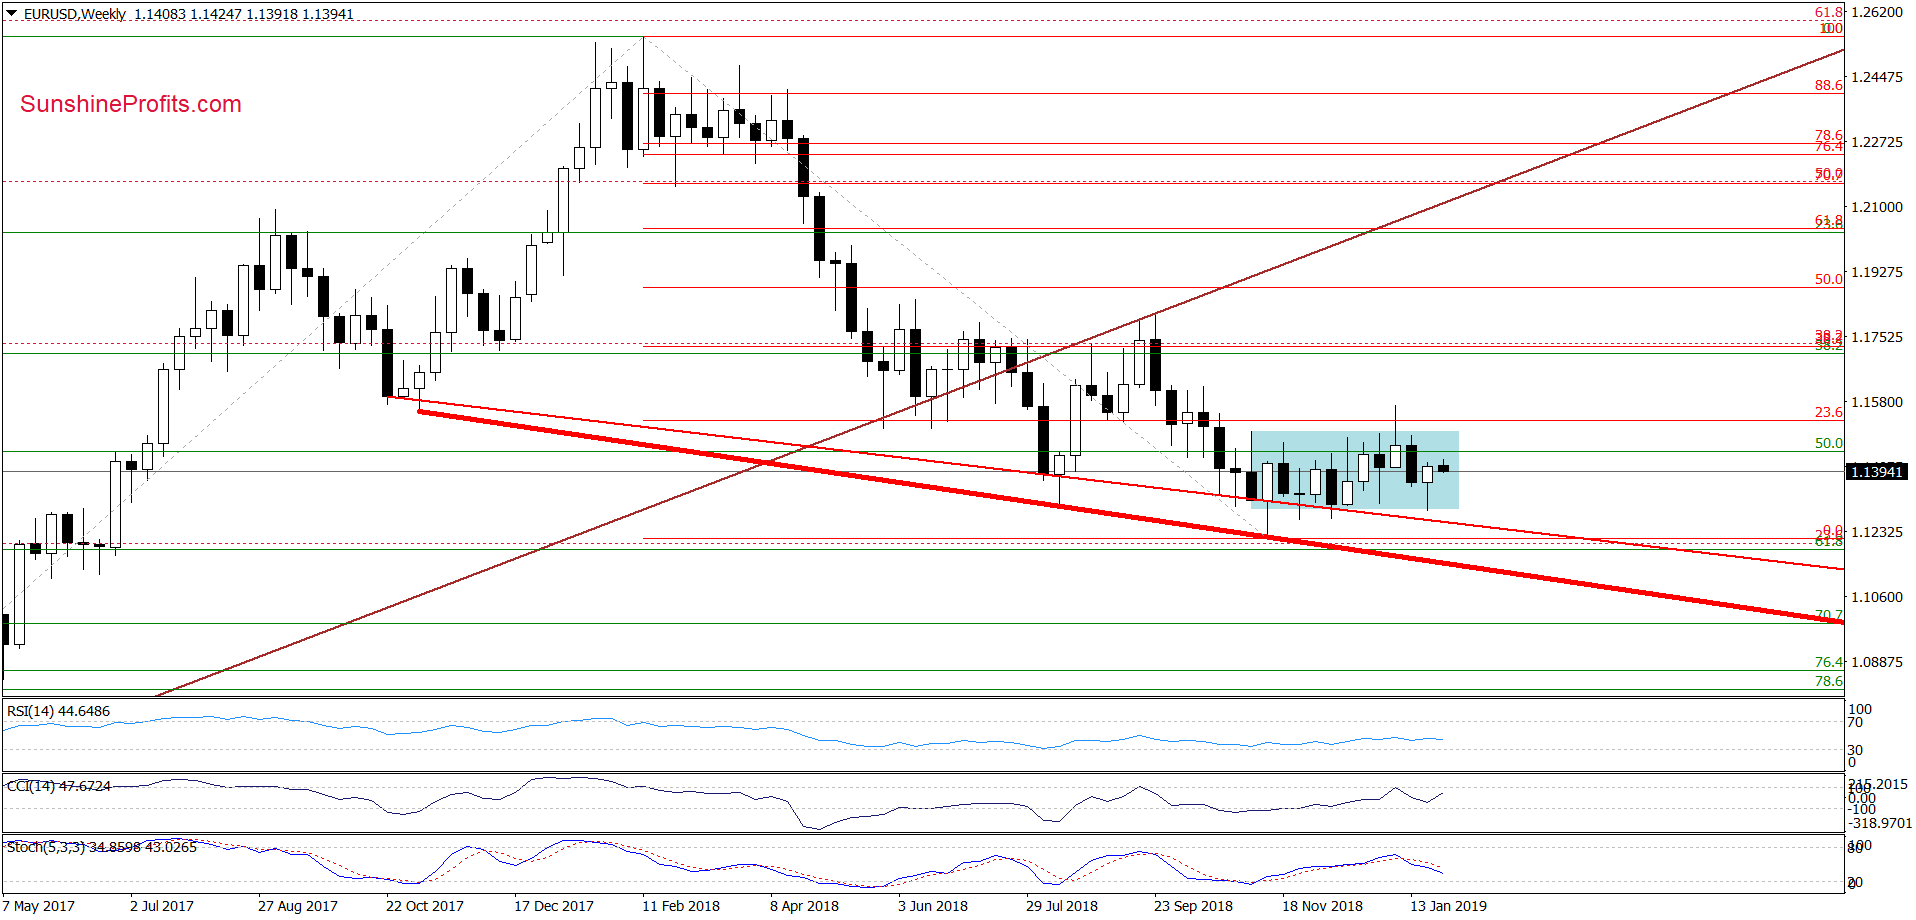
The weekly chart shows that the medium-term picture hasn’t changed much as EUR/USD is still trading inside the blue sideways trend. The price action is compressed and attempts at breakouts and breakdowns in recent weeks have been short-lived. The indicators do not speak the same language as RSI does not indicate any presence of a trend and Stochastics still has a way to go and flash a buy signal. Only the CCI may have some bullish implications here, but we’ll discuss that in greater detail below the following daily chart.
Let's move right to it.
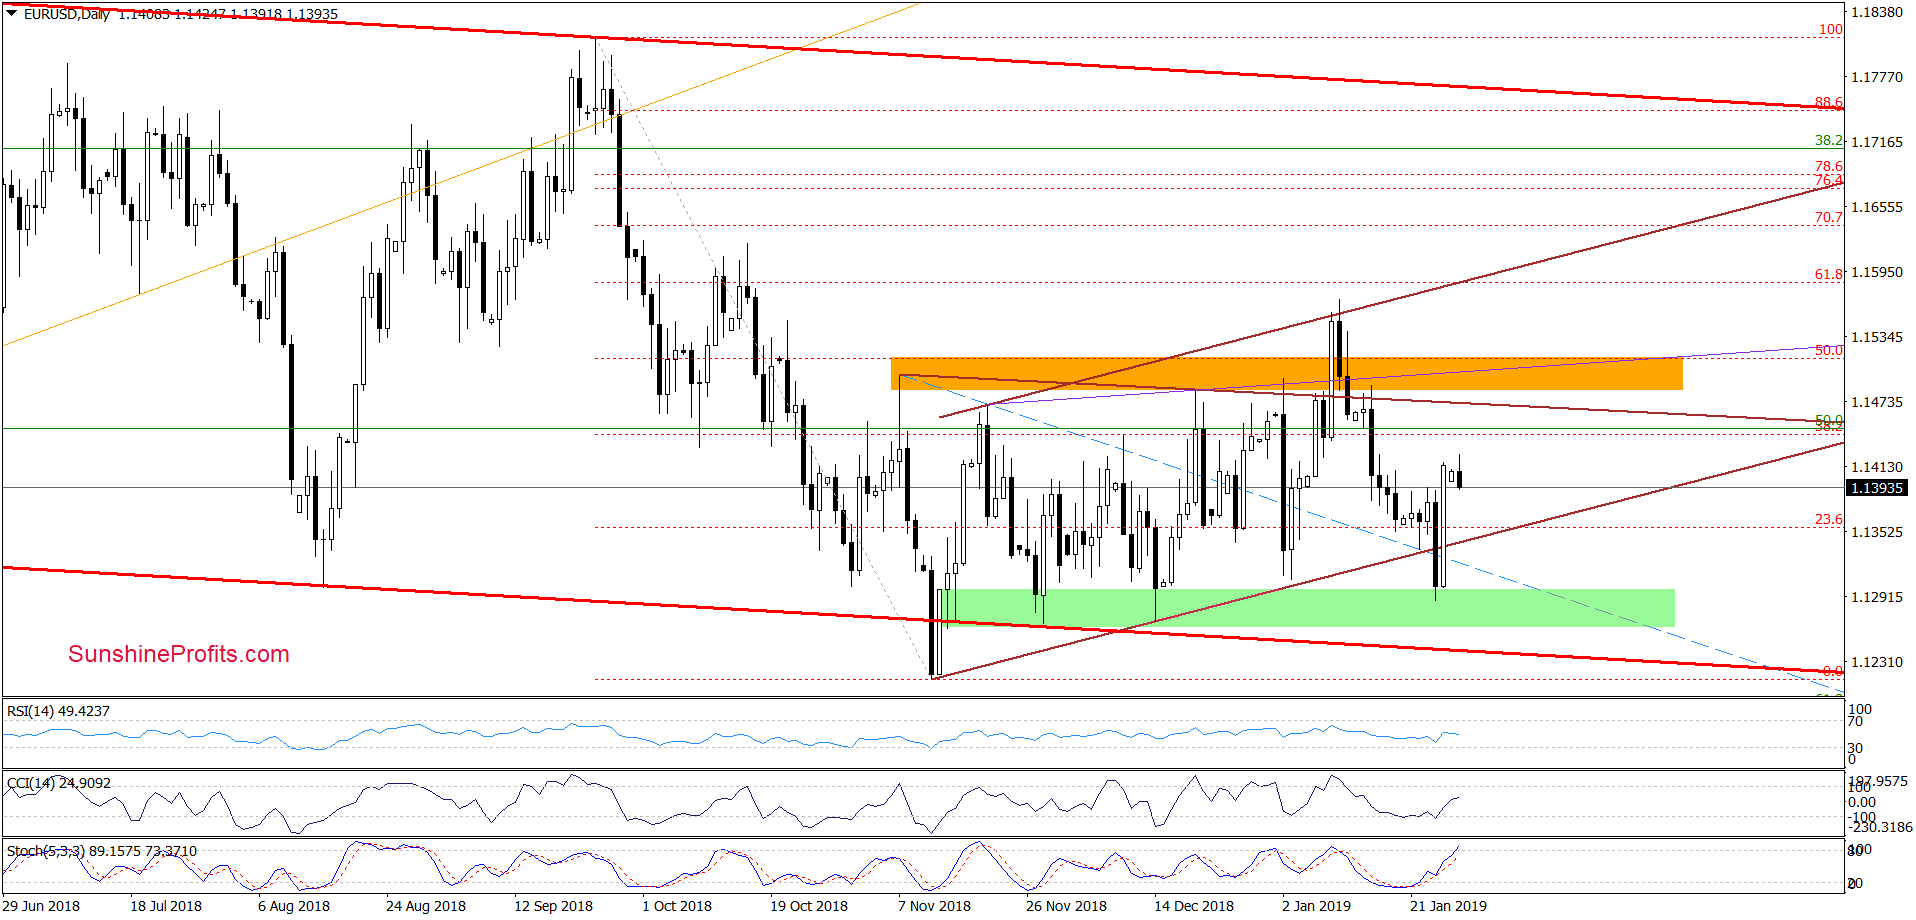
On Friday, EUR/USD moved sharply higher and invalidated the earlier breakdown under the lower border of the brown rising trend channel, which is a bullish development. In fact, it’s too bullish for us to continue to hold the short EUR/USD position – the position was automatically and profitably closed at the pre-determined level (our subscribers were prepared in advance) and we decided not to re-open the position based on what we’re seeing today.
Earlier today, the pair pulled back a bit, but the buy signals generated by the daily indicators remain on the cards, supporting the currency bulls and another upswing. Stochastics is showing a decent momentum with further room to grow and is not in a toppy position. Further, CCI has a potential to rise and RSI is far from levels previously marking local tops. Today's session will provide clues to whether we are seeing only a minor correction to Friday's bounce or not.
If the pro-growth scenario is indeed the case and the pair extends gains from the current levels, we’ll likely see a test of first the upper border of the brown triangle, and possibly also the orange resistance zone in the coming days.
USD/JPY – the Calm After the Storm
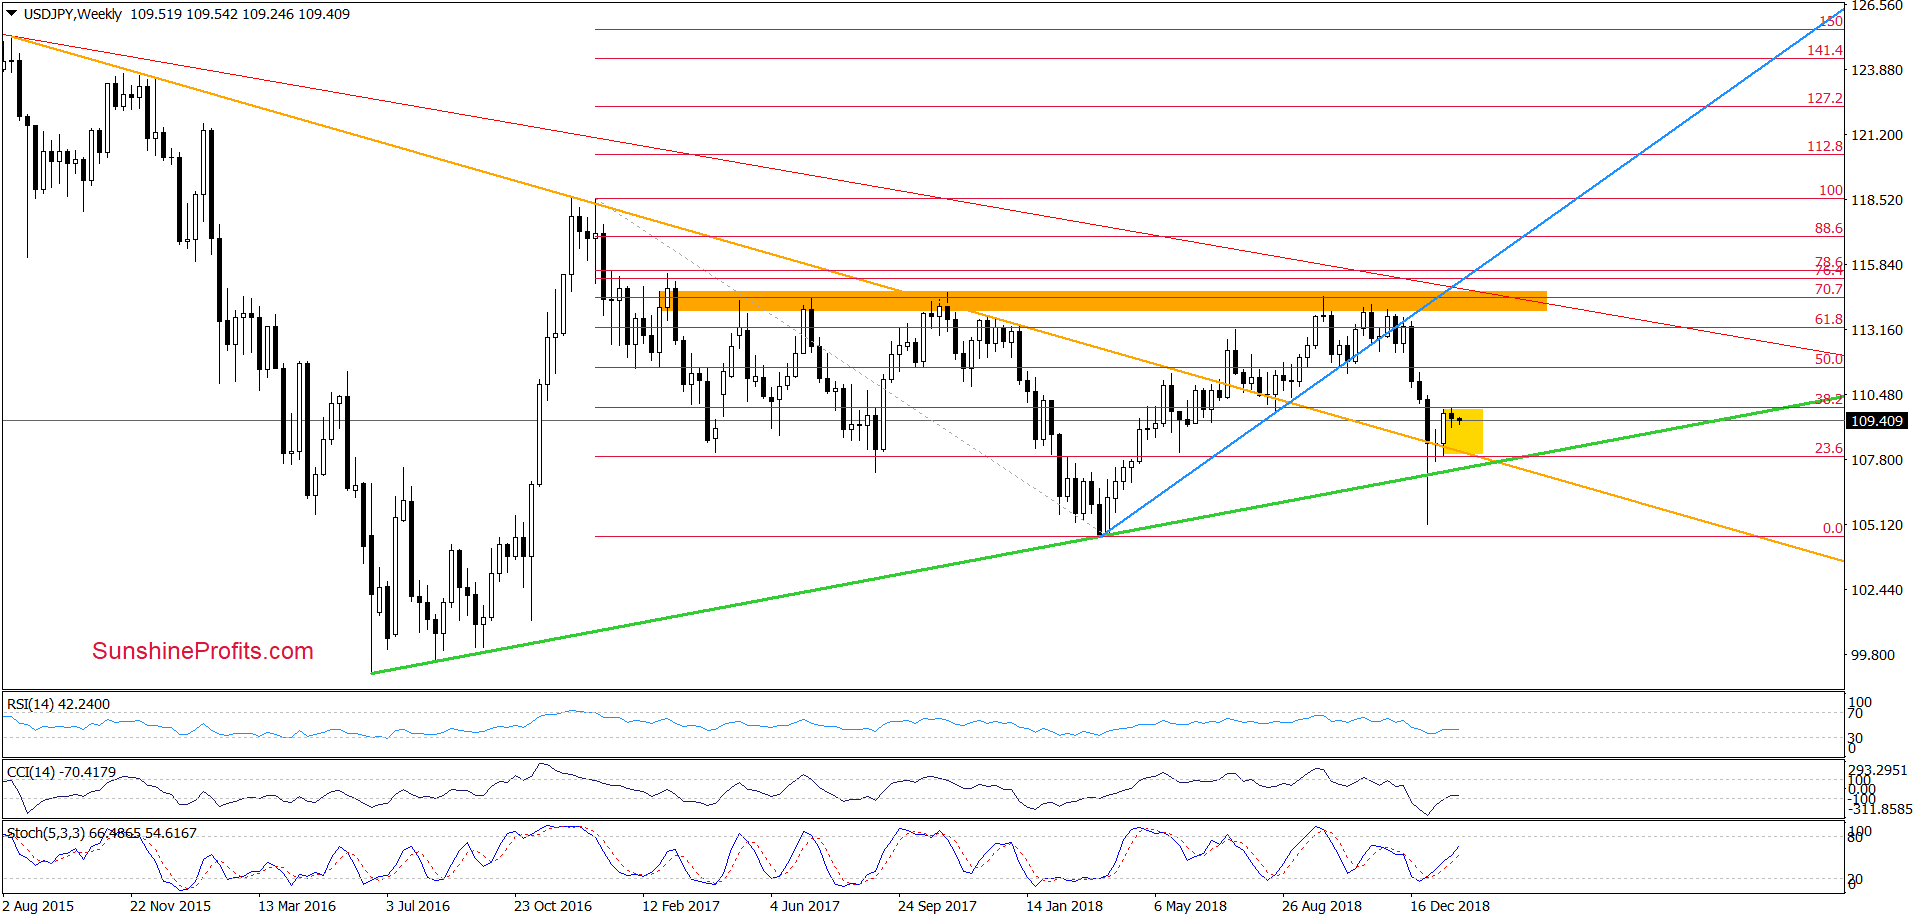
From the medium-term perspective, we see that USD/JPY closed the previous week inside the white candle preceding it, which suggests that as long as there is no breakout above the last week’s high, the currency pair will likely be trading inside the consolidation (marked in yellow).
Does the short-term picture provide us with further hints?
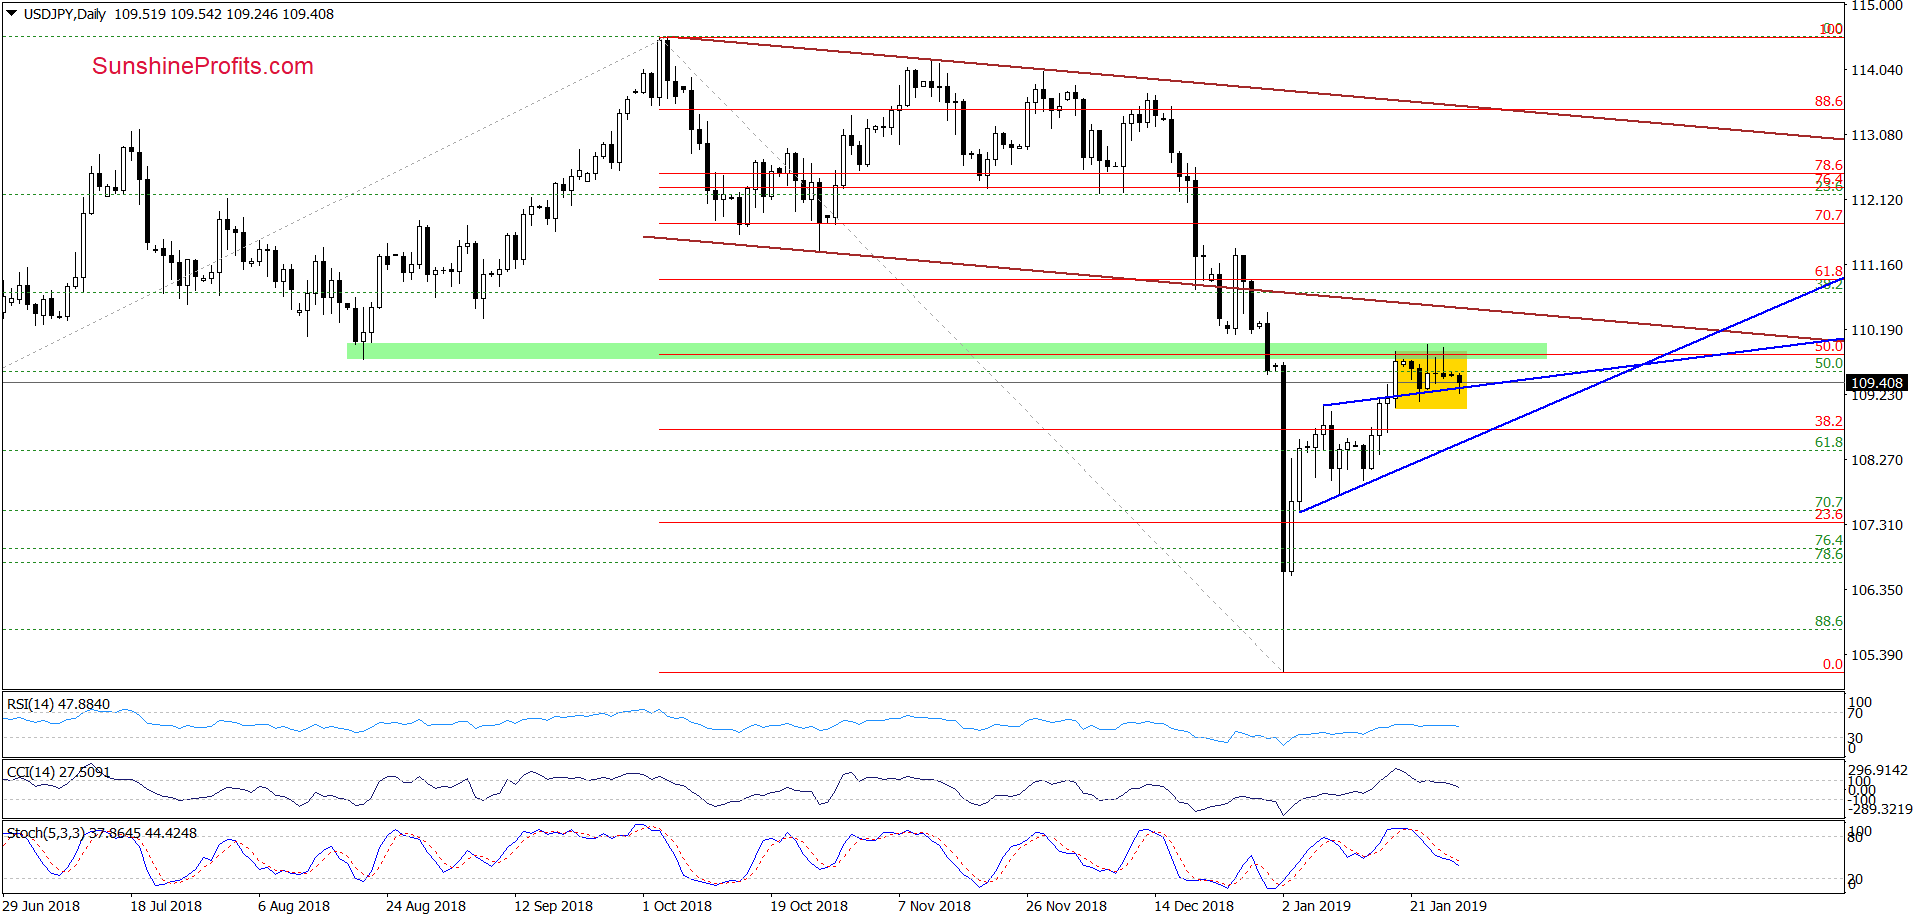
Looking at the daily chart, we see that the situation hasn’t changed much as the exchange rate remains trapped inside the yellow consolidation right below the green resistance zone and the 50% Fibonacci retracement. In the past several days, sellers have soundly rejected attempts to break through the green resistance zone as evidenced in the long upper knots of daily candles. All indicators have a slight bearish tint but price action must confirm this assumption first.
Therefore, what we wrote in our Forex Trading Alert on January 22nd, 2019 is up-to-date also today:
(…) the exchange rate is still trading inside the yellow consolidation, which has formed around the upper border of the blue triangle.
Additionally, the pair is still trading above this support line, which means that as long as there is no breakdown below it all downswings could be nothing more than a verification of the last week’s breakout.
Nevertheless, taking into account the proximity to the above-mentioned resistances (that stopped the buyers in the previous week) and the current position of the daily indicators (…), we think that another move to the downside is just around the corner.
Therefore, if we see an invalidation of the breakout above the blue triangle and a drop below the lower border of the yellow consolidation, we’ll likely open short positions, because USD/JPY would likely test at least the lower border of the triangle. We will keep you informed should anything change, or should we see a confirmation/invalidation of the above.
USD/CAD – Head-and-Shoulders, but only Potentially
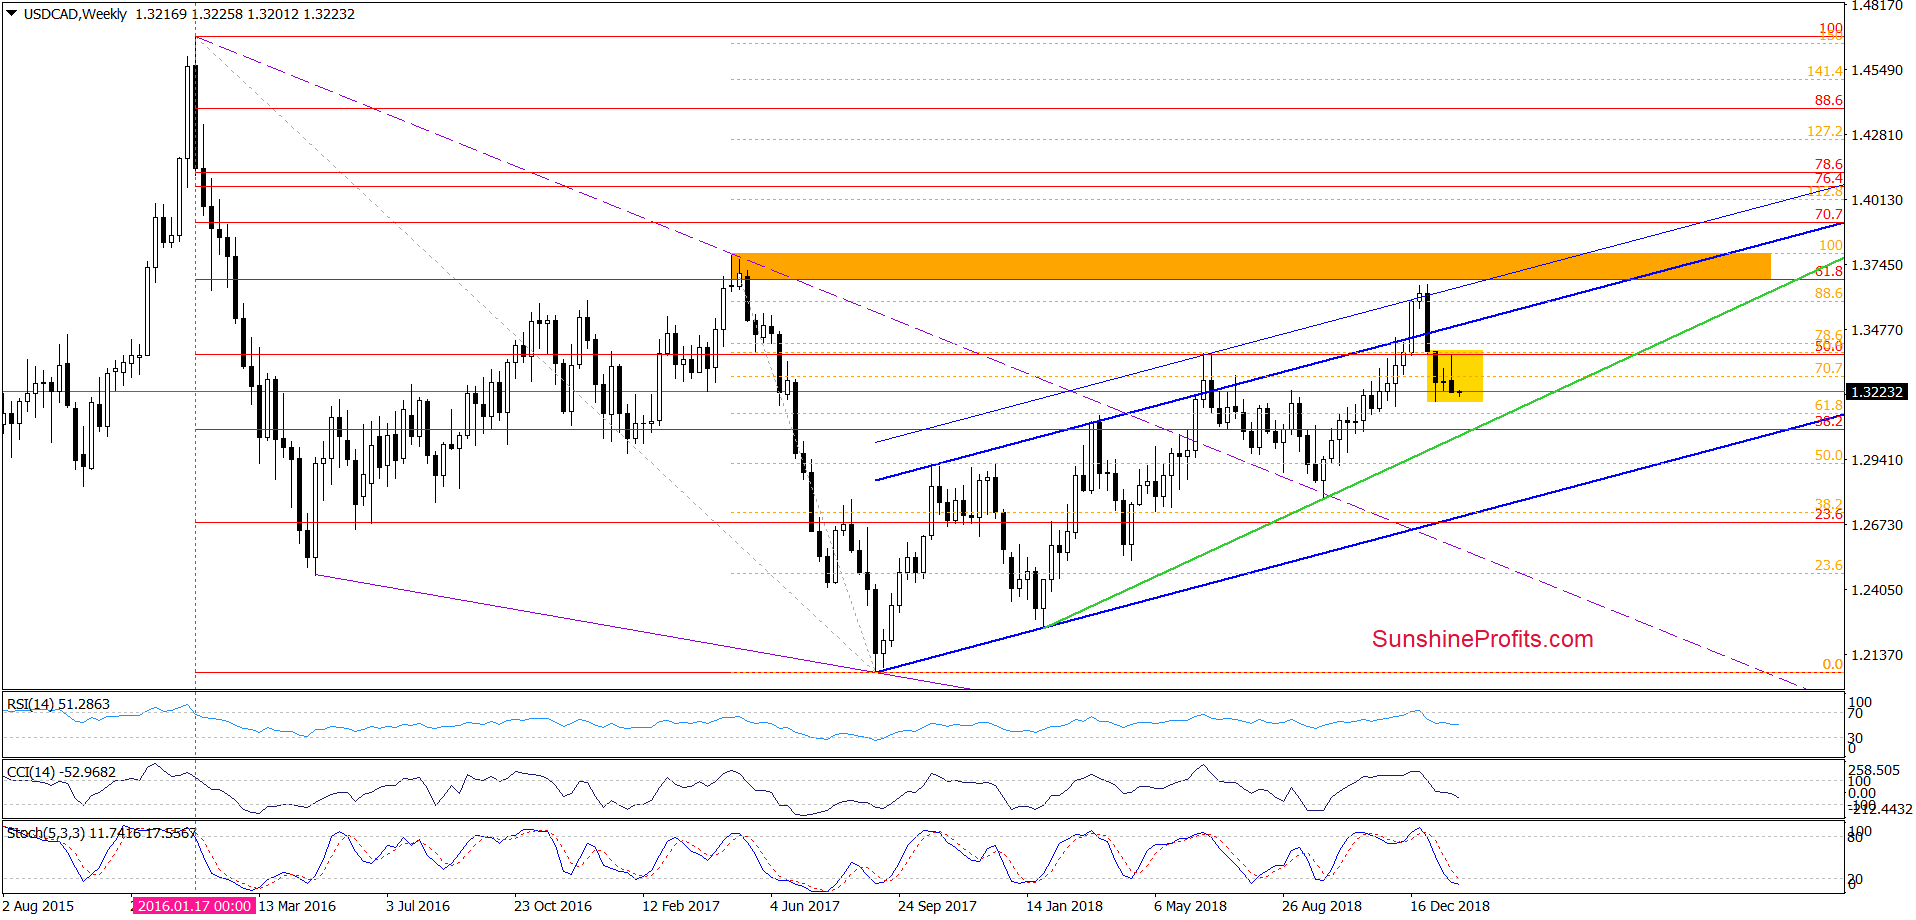
Another currency pair and another consolidation as shown by the weekly chart. Attempt to break above the channel formation marked by two blue rising lines has been rejected and the pair reverted inside the channel and remains currently inside the yellow consolidation. As long as there is no breakout above the upper line of the formation or a breakdown below the lower border, another bigger move is not likely to be seen.
Does moving to the short-term clarify the view?

On the daily chart, we see that the combination of the 38.2% Fibonacci retracement and the upper border of the green rising trend channel stopped the buyers, triggering a sharp correction of the recent upward move.
Thanks to this, USD/CAD slipped under the very short-term trend channel marked with green lines and approached the green support zone, which has the potential to stop the sellers again. Additionally, this area if further fortified with the red rising support line based on the early-December 2018 and early-January lows. This is important as it serves as a neckline of a potential head and shoulders formation. We are talking a formation in progress here, having marked the head and both the left and right shoulders with corresponding letters. Please remember that an incomplete formation is just that – incomplete, and as such, it does not yet have the implications worth to be acting upon.
Therefore, as long as there is no breakdown below the red neckline and a daily closure below it, the right arm can still be underway and opening any positions is not justified. However, if the sellers show strength and take the pair under these supports, we’ll consider opening short positions.


