
Equity Counter-Trend Rally In Place; Yields Bottoming Out; DXY Resumes The Uptrend
This actual Market Report was written pre-NY market opening, on Tuesday, March 26, and was updated until the NY market closed.
Here is the Market Report At The Chat, March 26, 2019.
The bounce in pre-NY trade was larger than I expected. But the models trump EWP in this instance -- they got it while yours truly was made to look clueless.
So we get are getting a bounce, and I presume that is now Wave 2 proper. The next stage, another hopefully sharper decline, may come tomorrow.
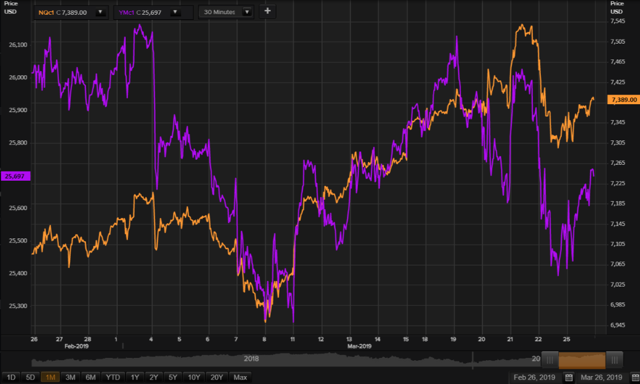
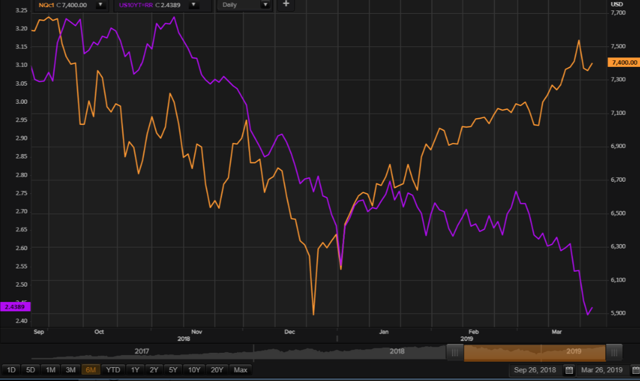
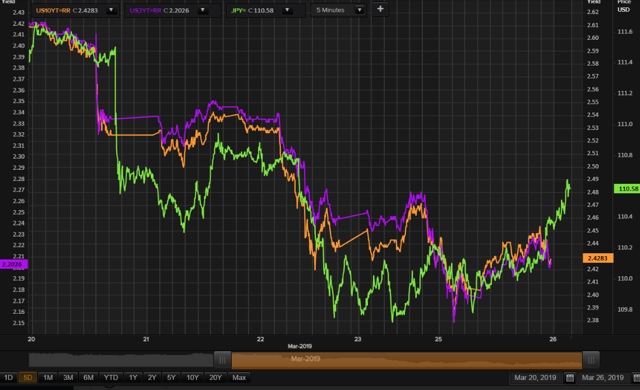
The key to the larger than I expected recovery, were the yields, which have come off the lows. And with USD/JPY looking frisky to the upside.
I expect the yields to rise further in line with the models dealing with yields. In fact, the change rate in yields is starting to rise, telling me that the actual turn up in the 10yr yield is just a day or two away,
This presents a kind of conundrum because we are expecting further equity market declines, while the yields are starting to turn around -- if we go by the models.
But maybe we SHOULD expect that to happen, because the two asset classes (bonds and equities) have been diverging significantly since early January when the recent bull phase started.
RM13 @RM13 Mar 26, 2019 9:35 AM
Well, let's see where it bounces...
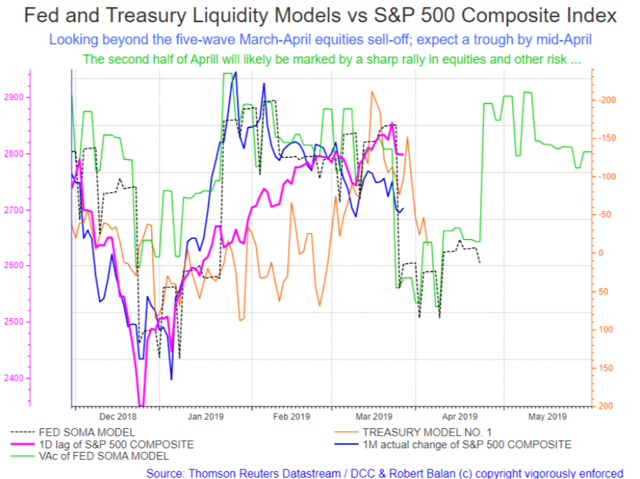
But regardless your models suggest upside is limited in US equity up model until early April
Well, @RM13, the downside in equities is likely to make a trough sometime just before mid-April (April 9-10 optimal), and the equity mini futures will probably be up another day from here. So it makes sense (at least to me) that the divergence shown in the chart above will narrow. And my guess is that yields will rise and equities will fall.
It will not be a constant process -- the reversion will likely occur in stages. Just look at the way both yields and equities performed from the October peak in stocks.
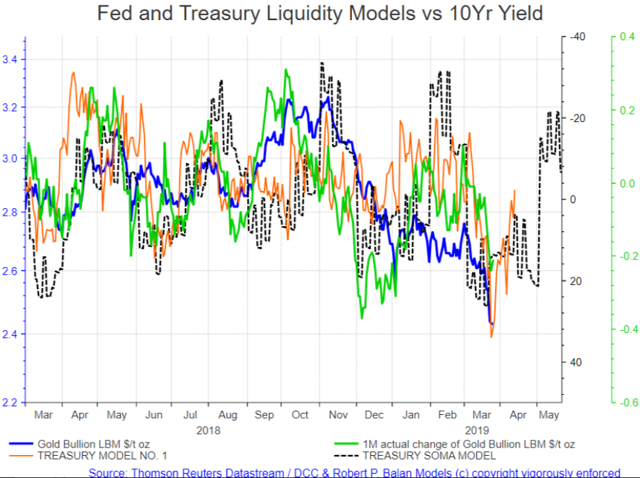
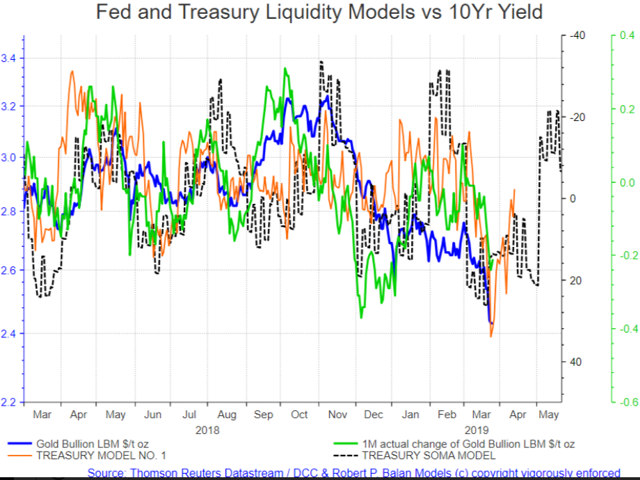
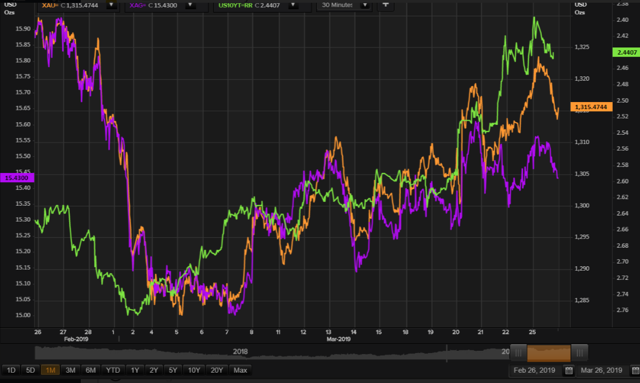
If I put the S&P Index in juxtaposition with the 10Yr yield in the Bond Model chart, you can see the emerging dynamics could make these two asset classes re-adjust to a mean.
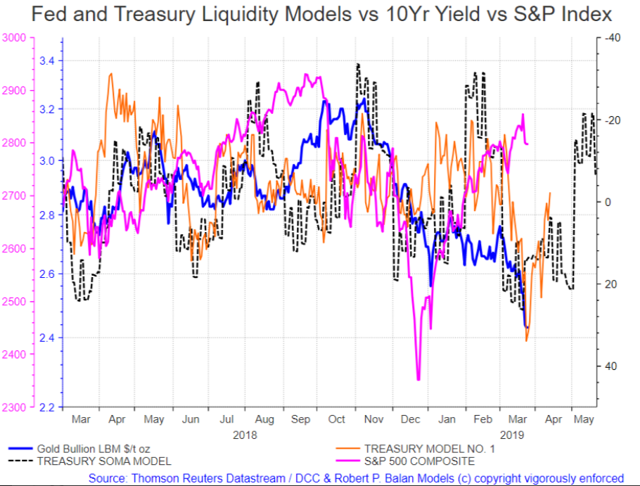
No change was made in the bond chart -- I just put in the S&P Index and removed some other data (the change rate of the 10yr yield for one), so we can see the relationship clearly.
What you can see is what I have been saying earlier about asset rotation, or at least the lags/leads they exhibit in responding to the inflow/outflow of liquidity. In this case you will see that equties are first repsonders, yields come second, then gold and DXY follow the yields.
Let's do a zoom in for better optics.
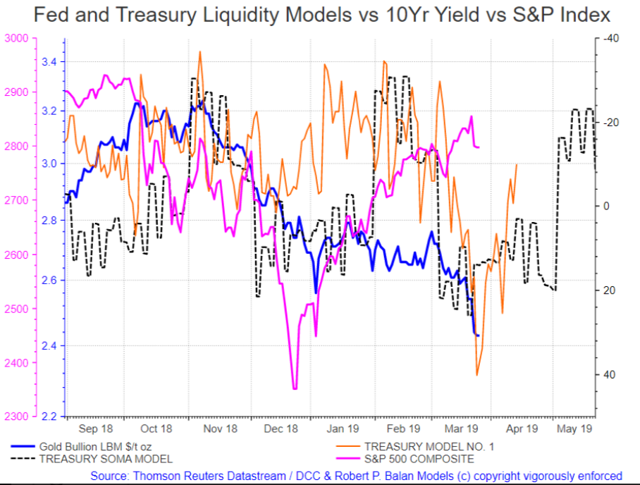
SPX change overs have always been ahead of the changes in yields, I suspect the yields this time are still catching up to the equities previous up phase.
This relationship will likely become clearer as yields turn up, the SPX continues falling for a while. And then both of them turn up when the stock markets goes into another huge rally (yields rally in a big way too) sometime in second half of April.
This we have to keep in mind as we track the assets in the immediate time frame. And right now we are being led to a time and level when/where we can possibly benefit from leveraged positions. That is the wave 3 sequence of the fives, which I expect will be seen starting tomorrow.
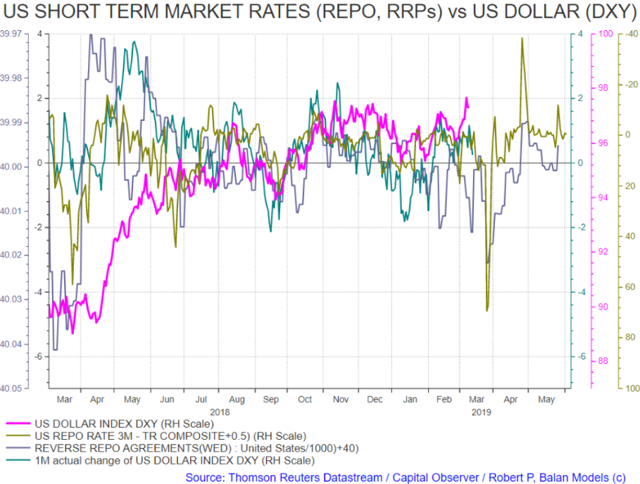
Meanwhile, the US Dollar is responding to the liquidity flow imperatives.
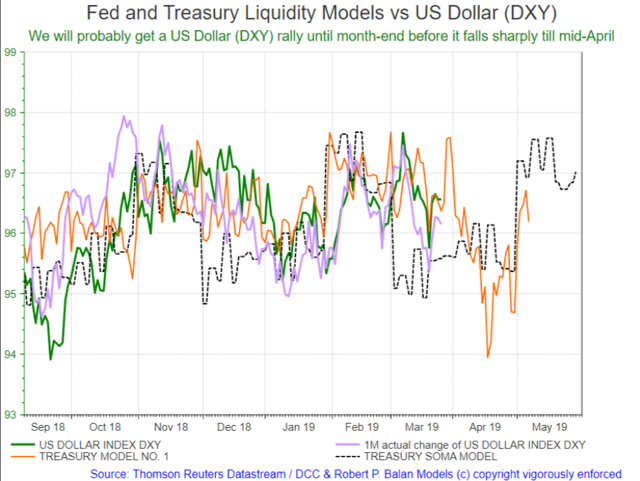
If the models as correct, today marks an intermediate low for DXY (see chart above). We should see a DXY rally, which would get tail winds from another day of recovery in equities tomorrow.
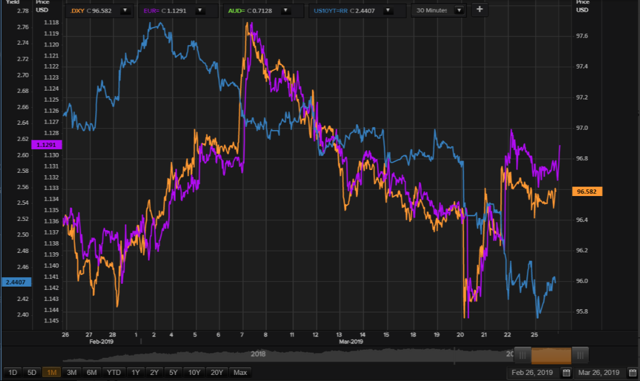
The optimal top for the DXY (per liquidity model) is the period of March 28-29. the then DXY falls sharply.
The DXY decline should catch up with the fall in equities -- and rising yields (if they will do it) may be of no help during that time to the DXY.
There may be another reason, and that is the DXY responds to a previous dislocation in the term (money) markets.
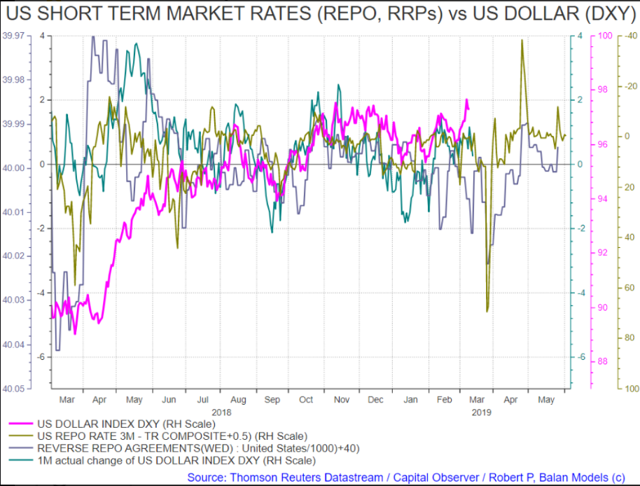
Of all the assets, the US Dollar is most sensitive to the SOMA activity of the NY Fed Reserve. Its relationship to the liquidity flows/outflows is solid, but there is nothing like perturbations in the short term market rates that could send the dollar (DXY) going bat-crazy for a brief period of time.
That chart by the way, I just got from my recent Dollar article at the PAM main site, if you want to know about it,
And the US Dollar (DXY) has the best frequency response to liquidity flows. The fidelity is amazing, so much so what when I am having trouble with the other assets classes, I frequently revert to what I know about the DXY's relationship with other asset classes (with the DXY-liquidity covariance as benchmark).
pa292 @pa292 Mar 26, 2019 10:19 AM
H Robert, : do you see 10 years yields going lower for the rest of 2019, or put it differently, do you see TLT going higher than 125 ?
pa292
The current models only give me the tools to pretend as an oracle only until late May -- knowing what happens to the rest of the year needs another set of tools. But I am working on it. Once I have it, then I will give it to the PAM community.
The Precious Metals are starting to catch up to the yields. But the DXY firm stance is providing a hindrance.
And the fact that yields are starting to rise also gives me a limit of how much higher (if any) is gold going to rise as DXY rises and yields rise. Probably zero.
I want to acquire more evidence, but I think we are seeing a temporary top in Gold, Silver and Miners at this point.
PAM is still long SLV, so that will be one priority Tim and I have today.
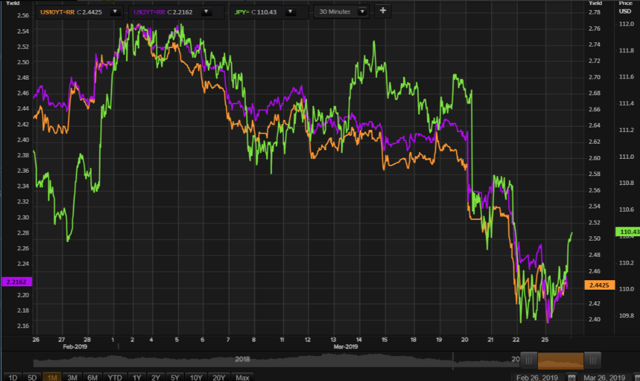
USD/JPY is leading the way for yields higher today, IMO.
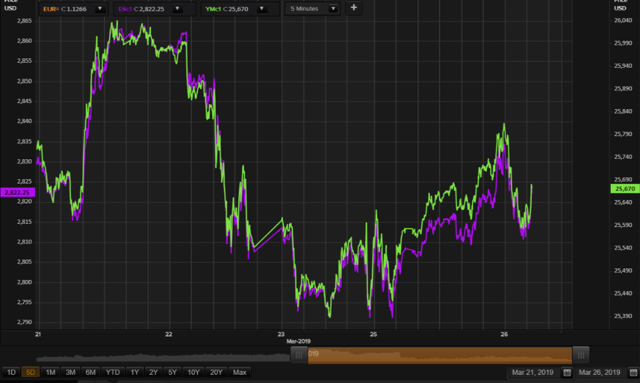
But early NY trade sold the pre-market rally, so we go into an intermediate pause, then probably a final rally to a Wave 2 top tomorrow in the equity minis.
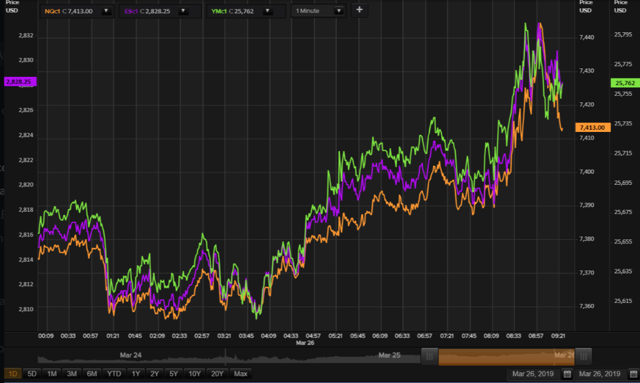
A 50 pct pause should provide 25,590 in the DJI mini, and then presumably the wave 2 countertrend rally resumes from there
Talk about finetuning too much -- wave 2 started in the oil sector, and caught me completely unaware, as most of it happened in Asia/Europe.
But I should have understood that the oil sector, at least for now, has been leading the equity markets by a day and would have gone ahead in the countertrend rally. But it also means that if SPX wave 2 peaks tomorrow, then oil's wave 2 should peak today.
We will know that soon enough.
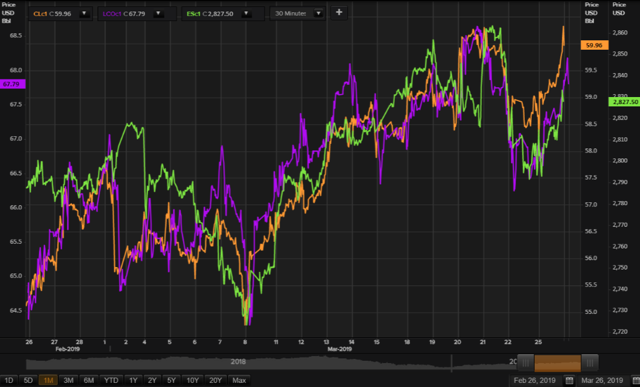
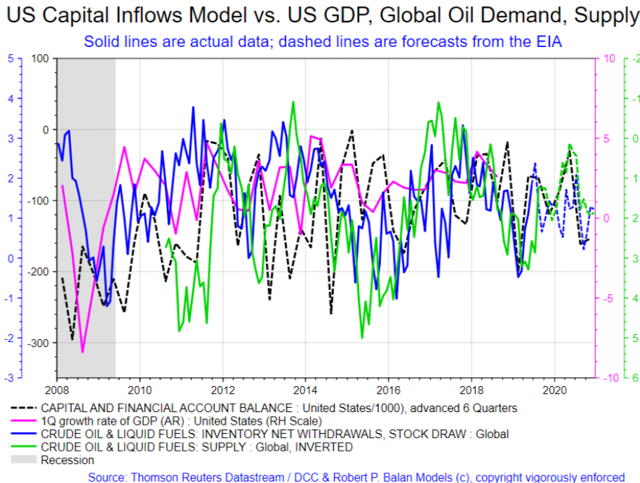
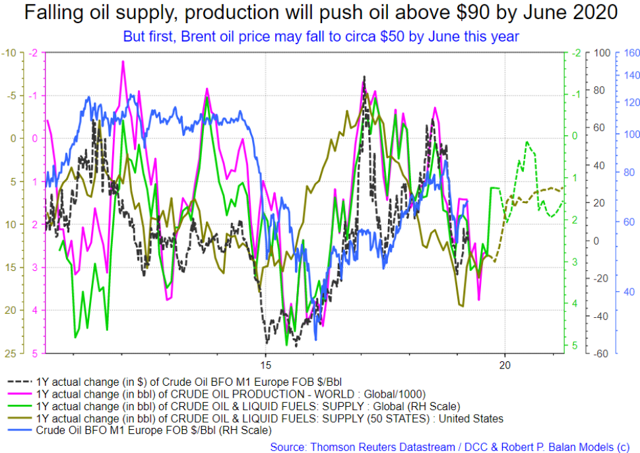
The lagged effect of the fundamentals in the oil product demand/consumption aspect is still not friendly.
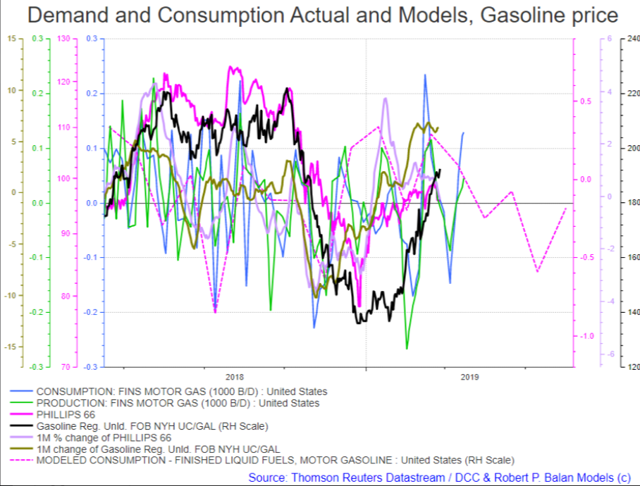
The sell-off should stay in effect until circa April 5 (optimal). Mind you, the data imperatives for this view are already baked in the cake -- the green and blue lines in the chart above are not modeled data, but ACTUAL demand and consumption data. the dashed pink line is the generic model of the consumption data, month on month.
So we should see a down-up-then-down again route for oil and oil equities over the near term.
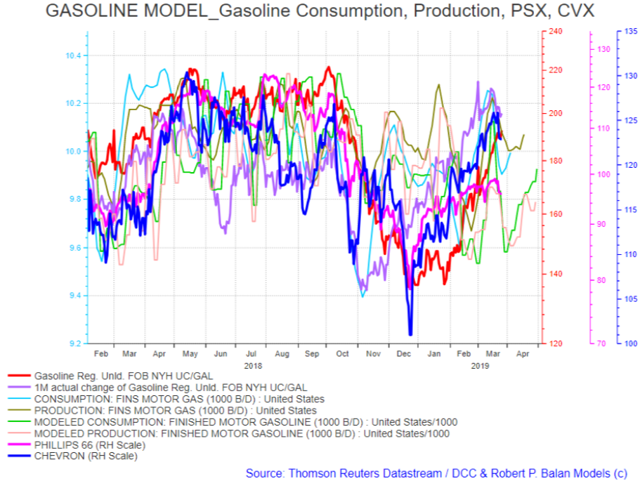
This provides a more comprehensive (although messier) view of the immediate-term term outlook for the oil sector. This model, for the info of members who just joined us, is available at the Tools tab at the PAM main portal.
I have been struck by the resilience of spot gasoline prices, and went back to an old model I have. I stopped following it three years ago, when the covariances got out of whack. But decided to revisit it since the current gasoline price behavior has stopped following consumption trends well. That old model is again back in synch with the previous data that I used to predict RBoB prices. There is assurance that it will continue to work, but for now, i believe we can use it to time spot gasoline price inflections points.
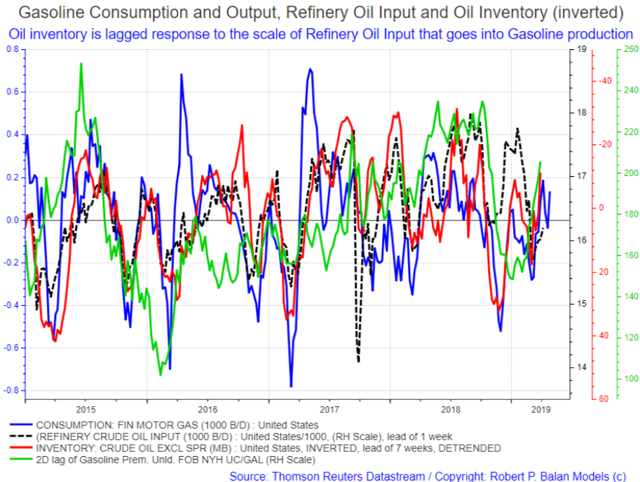
For now (at least), Oil inventory has become lagged response to the scale of Refinery Oil Input that goes into Gasoline production. that is the first relationship that you get from this covariance model,
The second item is that gasoline prices have again linked up (on a delayed basis) with the Refinery Oil Inputs data.
And the over-all prime mover is still gasoline consumption, but the clearer linkage is with the Refinery oil inputs. The kicker -- oil inventories may start building as from this week, for at least three weeks.
Finally, the copper group is still trading sideways. Nothing more to say about it until get into desired buy levels at lower prices.
END OF REPORT.
Open for discussions.
FlyTight @flytight Mar 26, 2019 11:22 AM
Thanks Robert. TNX like a yo-yo this morning opening at up 0.58%, dropped back down to 0.12, and now back to 0.58 after auctions, pushing the indices back up to new highs for the day. Gold did not lag by a day today as hoped for, but responded immediately to the change in yield direction and the rise in SPX. Tempting to short oils now after your report and short indices tomorrow, but perhaps at todays high. So the correction it seems was a three wave rather than a five wave, and this is wave-2 we are seeing today, and wave 3 to the downside tomorrow is what I believe you are sharing with us this morning right?
FlyTight You could be right about the three wave decline. But that is not universal, so I am still documenting it. I will tell you about it when I am done. But following the models' imperatives is now a safer way to go.
FlyTight @flytight Mar 26, 2019 11:29 AM
Ok thanks Robert. Just want to make sure I am reading you right. Cheers
No problem foleo. Feel free to ask questions on how to get around. Indeed the Tool tab is a useful initial stop when getting into PAM the first time.
walnut_rangoon @walnut_rangoon Mar 26, 2019 1:39 PM
This day in history. Over the last 20 years, the only March 26 where the front end of the eurodollar curve was more inverted than it is today was in 2007.
However, the seasonality of the tax day inflection is amazing and spans asset classes. The curve re-steepens every year on April 15. Shorting the VIX futures via a calendar spread starting on April 15 for two weeks has worked every single year since their inception except 2005. It's almost like a $100 bill laying on the sidewalk, and gives me appreciation Robert for your criticism of efficient markets.
RM13 @RM13 Mar 26, 2019 2:11 PM
Cool WR... And it's the curve steepening that deadens Curve Inversion Is Bad, But It's The Steepening After That Kills
Dont' worry about the curve flattening: since the mid-1980s, significant stock drawdowns (i.e. market crashes) began only when term slope started steepening after being inverted.
Robert P. Balan @robert.p.balan Leader Mar 26, 2019 2:19 PM
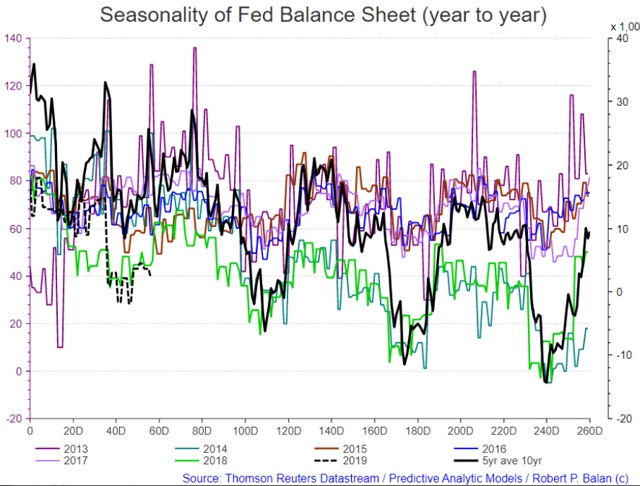
walnut_rangoon #However, the seasonality of the tax day inflection is amazing and spans asset classes.#That is not even the best part of this seasonality phenom. Let me show you several examples.
The seasonality of the Fed's Balance Sheet
walnut_rangoon @walnut_rangoon Mar 26, 2019 2:28 PM
That is true RM, although usually the steepening occurs from the Fed slashing short term rates faster than long-term yields can fall. You could argue in the past a recession has already been baked in the cake by Fed tightening by the time the Fed starts to frantically cut rates. The question may be what if the Fed was cautious enough to tighten slowly so they didn't have then panic and repeatedly slash rates. Could you get a 1998 type scenario where the risk party keeps on going?
JohnnydEFP @JohnnydEFP Mar 26, 2019 2:35 PM
walnut_rangoon - IMHO, we are looking at the beginning of a 1998 scenario. ... but on steroids this time.
Twodays @Twodays Mar 26, 2019 2:35 PM
Robert - may I ask your view on EEM in the upcoming correction?
walnut_rangoon @walnut_rangoon Mar 26, 2019 2:40 PM
I was thinking that as well Johnny, however Robert pointed out that we may see a sharp reflationary surge coming up such that the Fed is forced to retighten exactly as liquidity again falls off a cliff
So I guess 1998 => 2000 again but on a more compressed time scale if I interpret things correctly
RM13 @RM13 Mar 26, 2019 2:41 PM
walnut_rangoon If all CBers coordinate, they can pull off 1998. With the debt burden where it is and with Fed rate hikes we've seen, some tripwire may be set off before stimulus filters through the system. Maybe Robert has some insight? How quickly does Chinese CB stimulus filter through its economy and ours? What about BOJ, ECB, Fed?
walnut_rangoon Mar 26, 2019 2:28 PM
That is true RM, although usually the steepening occurs from the Fed slashing short term rates faster than long-term yields can fall. You could argue in the past a recession has already been baked in the cake by Fed tightening by the time the Fed starts to frantically cut rates. The question may be what if the Fed was cautious enough to tighten slowly so they didn't have then panic and repeatedly slash rates. Could you get a 1998 type scenario where the risk party keeps on going?
If you think politically, the system can have hiccups just in time for Dem primaries Jan 2020...
walnut_rangoon @walnut_rangoon Mar 26, 2019 2:54 PM
Yes I think the tripwire Robert has mentioned could be a larger than expected inflationary spike that forces CBs to re-tighten raising rates on all that debt. Could be some analogue to 1987 as well. It will probably come down to the timing of inflation vs. liquidity flows and we'll have to watch the exact evolution to see how the sequencing unfolds. Glad to have PAM's models and expertise on our side.
RM13 @RM13 Mar 26, 2019 2:57 PM
Everyone also miscalculates possibility of event driven large selloff, ala black Monday 1987. However, by my cursory look, those tend to happen in weaker dollar environments..
Robert P. Balan @robert.p.balan Leader Mar 26, 2019 2:57 PM
Twodays
EMM should do very well indeed, twodays.
Twodays Mar 26, 2019 2:35 PM
Robert - may I ask your view on EEM in the upcoming correction?

RM13 @RM13 Mar 26, 2019 2:58 PM
Robert, so DXY down for few weeks? And of course EEM, Us equities...
I want to bring up the possibility of large singular downward move.. My cursory review also suggests these happen in DXY down environments. Coming up soon:)?
walnut_rangoon @walnut_rangoon Mar 26, 2019 3:01 PM
personally I would argue 87 was a combination of market structure (portfolio insurance) combined with an elusive inflation spike that seemingly (to the Fed) came out of nowhere forcing them into multiple rapid hikes. Didn't hurt of course that the S&P had literally just doubled in the last 2 years.
RM13 I think this is what deals the DXY the coup de grace.
Twodays @Twodays Mar 26, 2019 3:13 PM
Robert P. Balan Thank you, Robert. It's hard for me to long EEM...remain on the sideline then. I was thinking EEM will perform worse than US equities.
You can go long the EM currencies. They will also do well.
#EatMoreWalnuts @.eatmorewalnuts Mar 26, 2019 3:16 PM
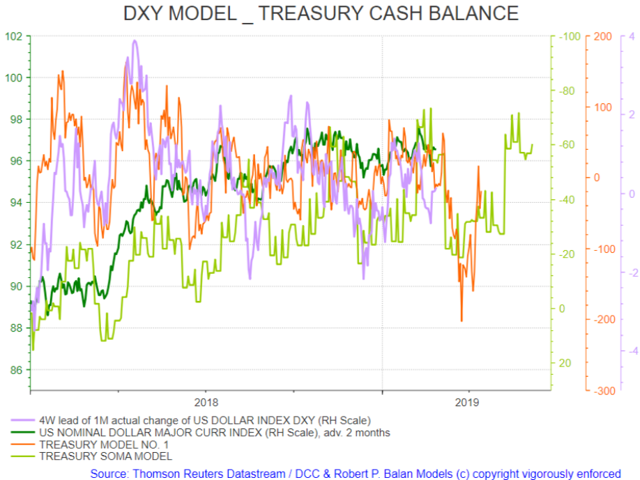
Robert P. Balan what is the significance of including the 1M change in some of these charts? for example, DXY in your previous chart.
#EatMoreWalnuts I have shown this chart several times before. The asset price change rate (the price flow) links to the change rates in liquidity (liquidity flow). The nominal asset price looks often a lot different from the rate of change of the data. But that is where the linkages can be seen.
If you can not associate the nominal risk asset price to the liquidity flows data, compare the two change rate data.
@walnut_rangoon #Yes I think the tripwire Robert has mentioned could be a larger than expected inflationary spike that forces CBs to re-tighten raising rates on all that debt.#
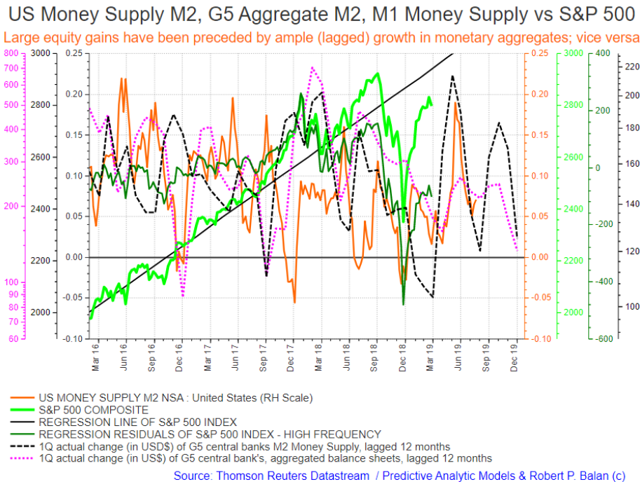
I have done this for DCC. Given the fact that external capital inflows positively impact everything from the US Dollar to yields, to housing and everything else, the way to validate the positive impact of the incoming capital is to use another advance indicator and proxy for growth.
The best lead indicator for growth is the net aggregate of oil supply and demand/consumption. If there is growth, this is where it begins and the aggregate data is a virtual source of wherewithal for GDP rise or decline.
So I used global oil demand/consumption, and better still used them as a pair. Demand/Consumption is positive to growth and supply is negative to growth.
I also know that capital flows have very long leads, and could take up to 2 years or longer before the maximum impact appears among the components of GDP. That I am absolutely certain -- I spent a great deal of time trying to understand this because I was amazed at the long lag. So of this I am sure.
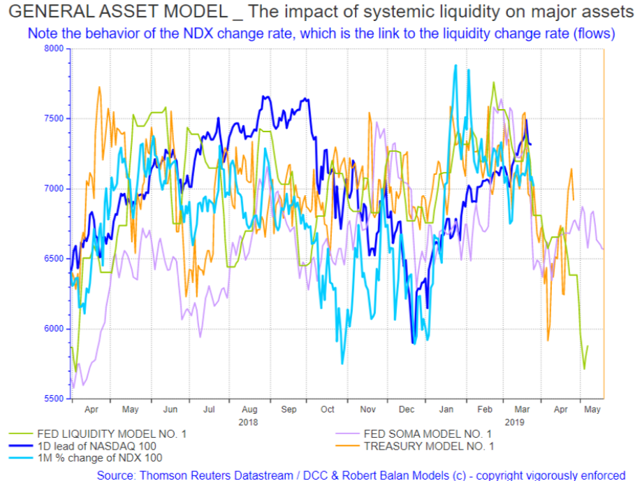
This is how it looks>
Robert P. Balan @robert.p.balan Leader Mar 26, 2019 3:47 PM
Note that it tallies very well with the template for higher crud oil prices in mid-2020s.
So a large equity bull phase by late April-early May makes sense, even without the models telling me.
The stock market is a very efficient discounting mechanism, and actually anticipates the change in economy by up to a quarter ahead.
And I tell you the bond market is even so, but it is lightly behind the SPX by two weeks or so.
It is when both are rallying (yields and SPX) that GDP growth will unlikely be dismal during the following quarter, and vice versa.
RM13 @RM13 Mar 26, 2019 3:57 PM
Thank you Robert.. I didn't see the EEM inverted - so yes, EM will do well, not badly, in near future..
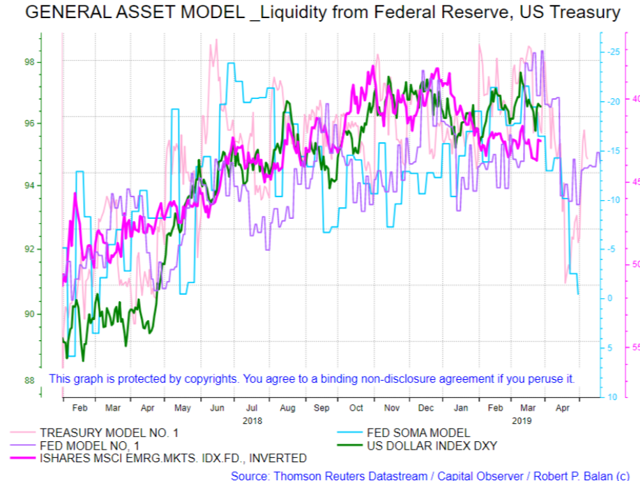
But looking at these graphs, we should see equity draw down in later half of the year, correct?
And I presume DXY weakness should be good for PMs
@RM13
#But looking at these graphs, we should see equity draw down in later half of the year, correct?#
That has been a foregone conclusion since we started to show this chart about 5 to 6 weeks ago. Alan Longbon absolutely loves this chart.
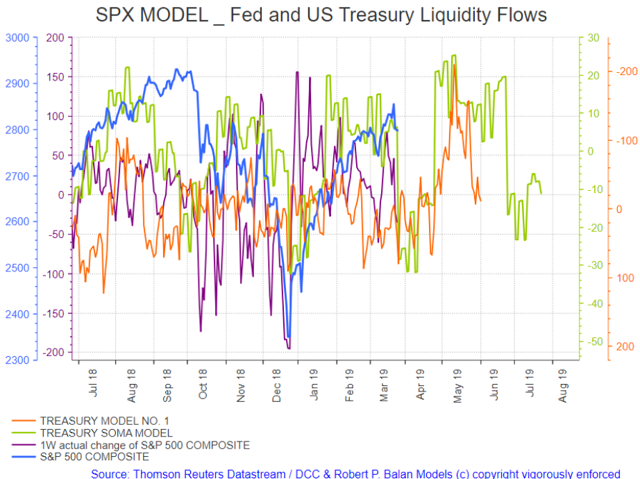
And here is an unrestrained, full picture of that impact of liquidity from the Fed and Treasury -- although I can only vouch for the next 45 days. The later data can be altered by new information coming in that is why I limit my showing you to 45 days ahead.
Alan Longbon @Alan.Longbon Mar 26, 2019 5:30 PM
And its the middle of the share buy back ban in the earnings season and the failure of the Trump trade talks.
Just a guess -- but I think we will probably plumb the support at 25,390 on the Dow mini before continuing the sideways range. Tomorrow we probably complete Wave 2 and hope to see the start of a large Wave 3 down.
MARKET CLOSED
Predictive Analytic Models (PAM) provides REAL-TIME trading advice and strategies using guidance from US Treasury, Federal Reserve and term market money flows. PAM also provides LIVE modeled tools to subscribers in trading equities, bonds, currencies, gold and oil -- assets impacted by ebb and flow of systemic money. Sophisticated LIVE models to trade and invest in the oil sector are provided as well. PAM's veteran investors and seasoned traders can use PAM's proprietary tools 24X7 via PAM's SA service portal.
Disclosure: I am long SLV, UUP, CRAK, DRIP.
Why not take a free two-week trial subscription, have a look and see if this community of veteran investors is a good fit for you? more


Good one Robert.
Agreed.
Hey Alan,
Thanks for steering me to TalkMarkets. You were on holiday?s?
Yes on holiday but back now.