Wednesday, August 21, 2019 12:12 PM EDT
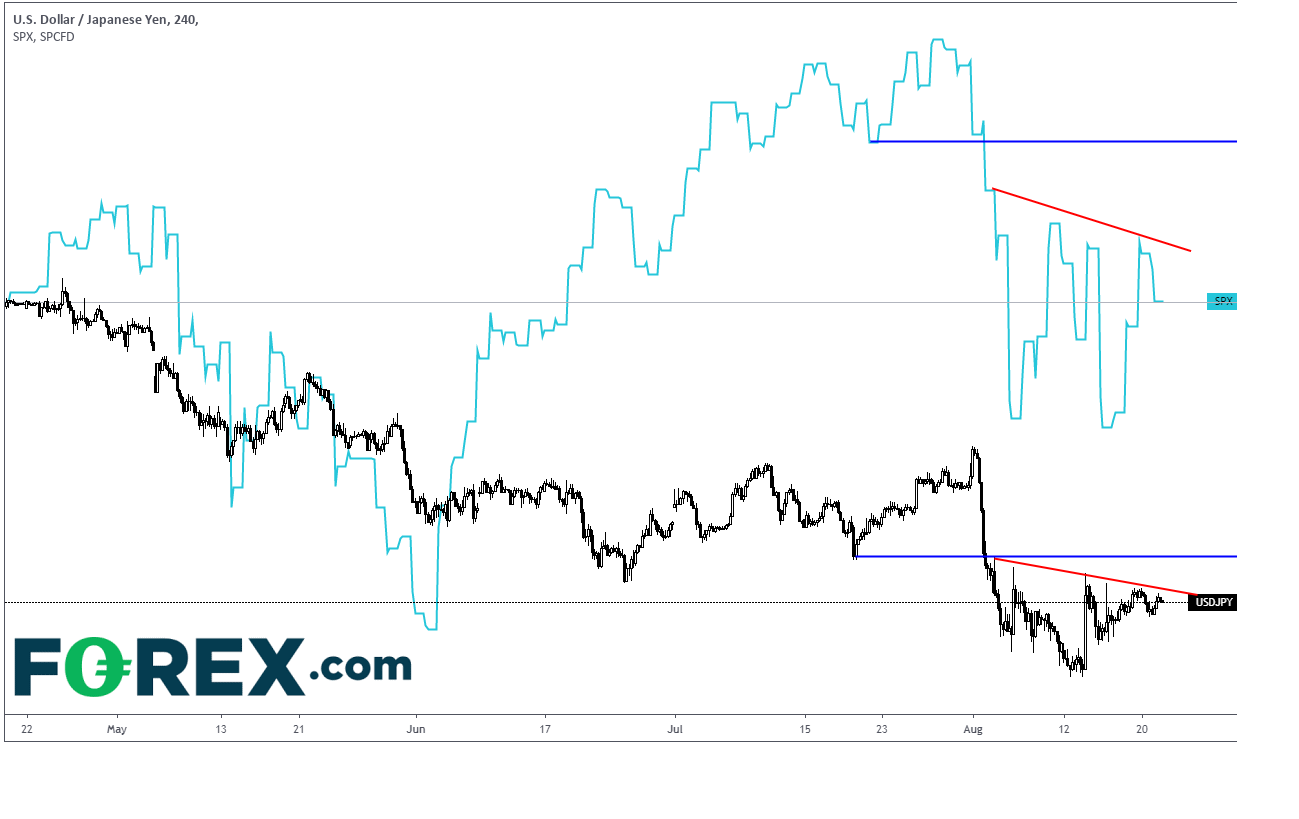
Just from looking at a chart of the price action, one can see that the USD/JPY and the S&P 500 are strongly correlated. As you can see from the 240-minute chart below, the 2 instruments generally move together:
(Click on image to enlarge)
Source: Tradingview, FOREX.com
When stocks sell off, USD/JPY tends to sell off as well. The reverse is also true: As stocks go bid, USD/JPY tends to go bid as well. The reason is that the Yen is considered to be an extremely safe asset.
We have some important events occurring over the next few days, which may add some volatility to the 2 instruments:
Today: July FOMC meeting minutes
Thursday: PMI manufacturing data
Friday: Fed Chairman Powell speaks at Jackson Hole
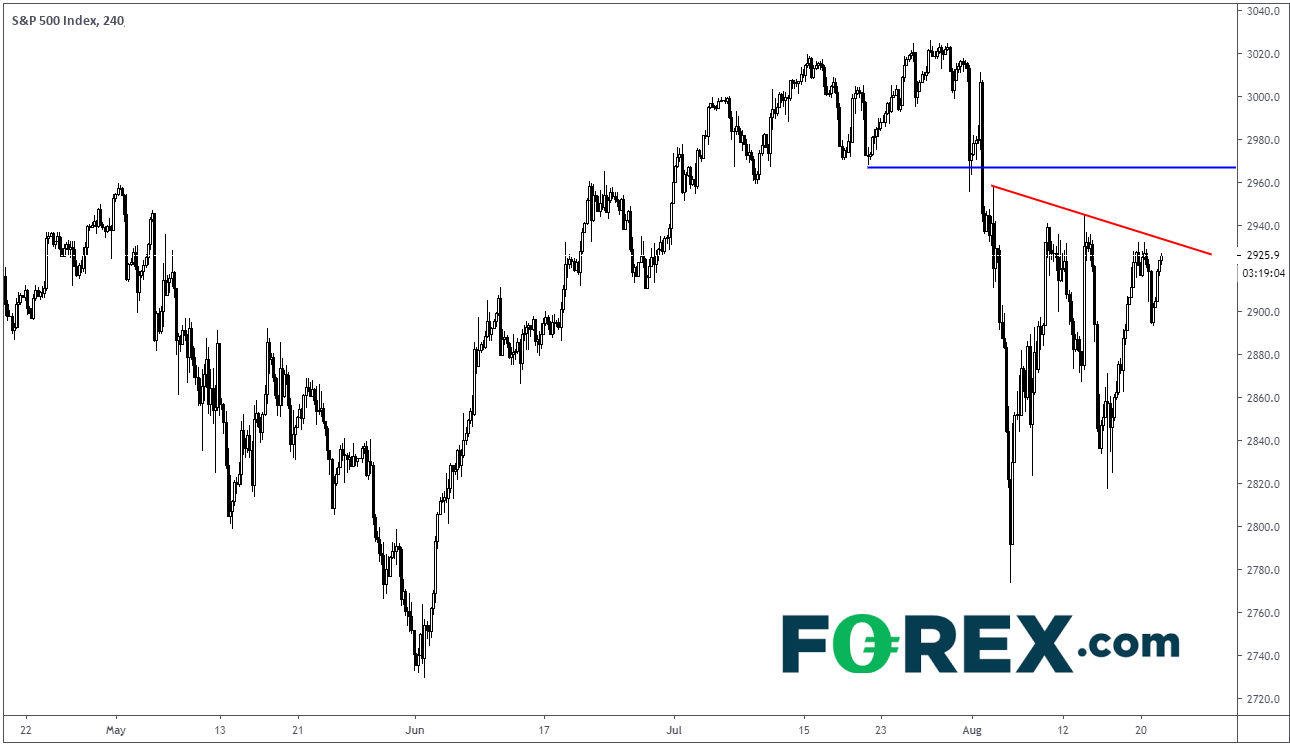
If the S&P 500 takes out the Trendline resistance at 2933, there is room to move up to horizontal resistance near 2965.
(Click on image to enlarge)
Source: Tradingview, FOREX.com
If that happens, keep an eye on USD/JPY. If the currency pair continues to move with the S&P 500, USD/JPY could take out the trendline at 106.42 and there will be room to run up to horizontal resistance near 107.25.
(Click on image to enlarge)

Source: Tradingview, FOREX.com
If you are looking to trade USD/JPY, you may want to watch the S&P 500!
Disclaimer:
The information on this web site is not targeted at the general public of any particular country. It is not intended for distribution to residents in any country where such ...
more
Disclaimer:
The information on this web site is not targeted at the general public of any particular country. It is not intended for distribution to residents in any country where such distribution or use would contravene any local law or regulatory requirement. The information and opinions in this report are for general information use only and are not intended as an offer or solicitation with respect to the purchase or sale of any currency or CFD contract. All opinions and information contained in this report are subject to change without notice. This report has been prepared without regard to the specific investment objectives, financial situation and needs of any particular recipient. Any references to historical price movements or levels is informational based on our analysis and we do not represent or warranty that any such movements or levels are likely to reoccur in the future. While the information contained herein was obtained from sources believed to be reliable, author does not guarantee its accuracy or completeness, nor does author assume any liability for any direct, indirect or consequential loss that may result from the reliance by any person upon any such information or opinions.
Futures, Options on Futures, Foreign Exchange and other leveraged products involves significant risk of loss and is not suitable for all investors. Losses can exceed your deposits. Increasing leverage increases risk. Spot Gold and Silver contracts are not subject to regulation under the U.S. Commodity Exchange Act. Contracts for Difference (CFDs) are not available for US residents. Before deciding to trade forex and commodity futures, you should carefully consider your financial objectives, level of experience and risk appetite. Any opinions, news, research, analyses, prices or other information contained herein is intended as general information about the subject matter covered and is provided with the understanding that we do not provide any investment, legal, or tax advice. You should consult with appropriate counsel or other advisors on all investment, legal, or tax matters. References to Forex.com or GAIN Capital refer to GAIN Capital Holdings Inc. and its subsidiaries. Please read
Characteristics and Risks of Standardized Options
.
less
How did you like this article? Let us know so we can better customize your reading experience.


