
British Pound Latest: UK Inflation Hits A 40-Year High, GBP/USD Slides
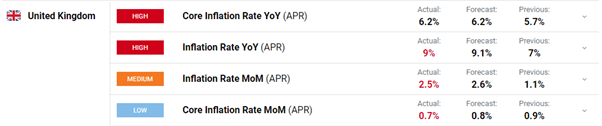
Prices in the UK rose by 9% in April year-on-year, a fresh 40-year high and yet another worrying print for the Bank of England (BoE). While the number will provoke many tabloid headlines, financial markets had expected a slightly higher reading of 9.1% today, leaving the Sterling relatively unchanged to lower post-release.
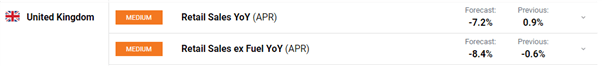
The next UK data release of note is Friday’s Retail Sales report for April. Always a volatile release, this report is expected to show consumers keeping their hands firmly in their pockets with sales seen contracting. Sky-high inflation and consumers’ reticent to spend is a tough double for the BoE to counter.
GBP/USD jumped in excess of 1.3% on Tuesday, its best performance in nearly 18-months after the UK Jobs Report showed that the labor market remains in rude health. The unemployment rate fell to 3.7%, its lowest level in 50-years, while average earnings including bonuses rose by 7% in March as employers paid more to keep existing staff.
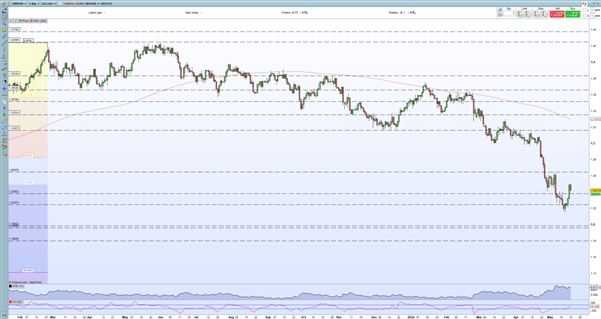
The rally in cable was also aided by a slightly weaker US dollar as traders pared back recent bets on the greenback. The US dollar basket (DXY) was hit by hawkish Euro commentary from ECB council member Klaas Knot who mooted the possibility of a 50 basis point rate hike sometime this year, the first time any council member has mentioned this number. The Euro rallied, pushing the US dollar basket lower. Cable hit and then reversed around 1.2500 on Tuesday, a 61.8% Fibonacci retracement level, and the pair are now looking to see if they can break back below 1.2400. Below here support is seen at 1.2382 and 1.2274.
GBPUSD Daily Price Chart
(Click on image to enlarge)
Retail trader data show 69.52% of traders are net-long with the ratio of traders long to short at 2.28 to 1. The number of traders net-long is 12.59% lower than yesterday and 19.96% lower from last week, while the number of traders net-short is 40.21% higher than yesterday and 50.83% higher from last week.
We typically take a contrarian view of crowd sentiment, and the fact traders are net-long suggests GBP/USD prices may continue to fall. Yet traders are less net-long than yesterday and compared with last week. Recent changes in sentiment warn that the current GBP/USD price trend may soon reverse higher despite the fact traders remain net-long.
What is your view on Sterling – bullish or bearish?
Disclosure: See the full disclosure for DailyFX here.


