
AUD/USD Rate Selloff Pushes RSI Back Into Oversold Territory

AUD/USD trades to a fresh yearly low (0.6834) with the US stock market on track to enter a bear market, and current market themes may push the exchange rate towards the June 2020 low (0.6648) as major central banks alter the course for monetary policy in an effort to tame inflation.
Looking ahead, it seems as though the Federal Reserve will continue to move ahead of its Australian counterpart as Chairman Jerome Powell reveals that “there is a broad sense on the Committee that additional 50 basis point increases should be on the table at the next couple of meeting,” and expectations for a further shift in Fed policy may keep the US Dollar afloat as the Federal Open Market Committee (FOMC) plans to wind down its balance sheet starting in June.
Meanwhile, the Reserve Bank of Australia (RBA) appears to be on a more gradual path in normalizing monetary policy as the “Board does not plan to reinvest the proceeds of maturing government bonds” and it seems as though Governor Philip Lowe and Co. will allow its holding to naturally roll off its balance sheet as the central bank “is not currently planning to sell the government bonds that the Bank purchased during the pandemic.”
In turn, expectations for another 50bp Fed rate hike may keep AUD/USD under pressure ahead of the next RBA rate decision on June 7 amid the deterioration in risk appetite, and a further decline in the exchange rate may fuel the tilt in retail sentiment like the behavior seen during the previous year.
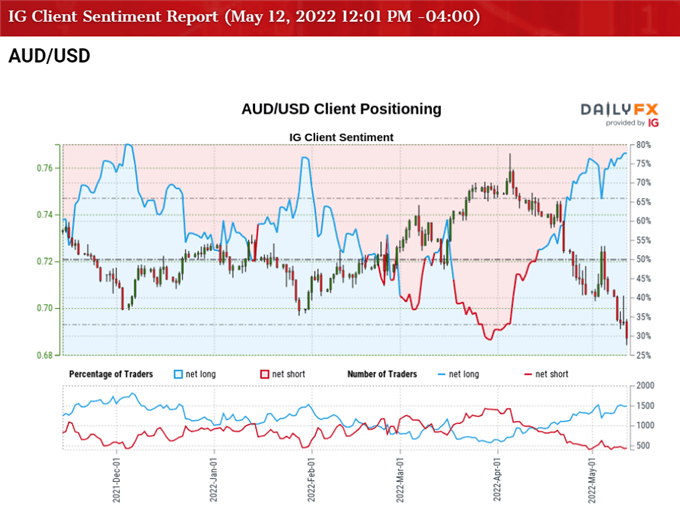
The IG Client Sentiment Report shows 74.02% of traders are currently net-long AUD/USD, with the ratio of traders long to short standing at 2.85 to 1.
The number of traders net-long is 8.09% higher than yesterday and 22.30% higher from last week, while the number of traders net-short is 7.50% higher than yesterday and 19.50% lower from last week. The crowding behavior has eased from earlier this week despite the rise in net-long interest as 75.68% of traders were net-long AUD/USD earlier this week, while the decline in net-short position comes as the exchange rate trades to a fresh yearly low (0.6834).
With that said, AUD/USD may attempt to test the June 2020 low (0.6648) amid the weakness across commodity bloc currencies, and a move below 30 in the RSI is likely to be accompanied by a further decline in the exchange rate like the price action seen earlier this month.
AUD/USD RATE DAILY CHART
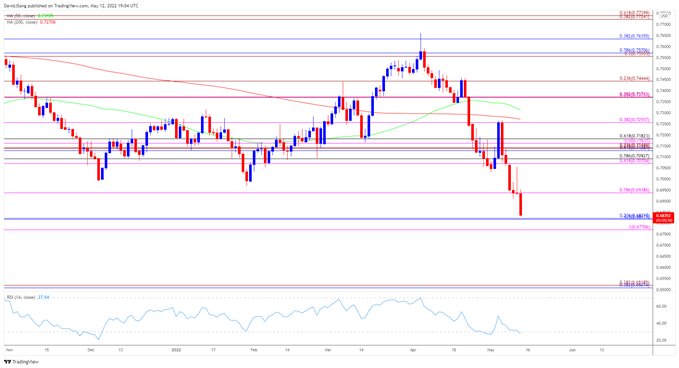
Source: Trading View
- AUD/USD takes out the July 2020 low (0.6877) after snapping the opening range for May, with the Relative Strength Index (RSI) flirting with oversold territory as the exchange rate slips to a fresh yearly low (0.6834).
- A move below 30 in the RSI is likely to be accompanied by a further decline in AUD/USD like the price action seen earlier this month, with a break/close below the Fibonacci overlap around 0.6770 (38.2% expansion) to 0.6820 (50% retracement) raising the scope for a test of the June 2020 low (0.6648).
- Next area of interest comes in around 0.6510 (38.2% retracement) to 0.6520 (38.2% expansion) followed by the May 2020 low (0.6373).
- However, lack of momentum to break/close below the Fibonacci overlap around 0.6770 (38.2% expansion) to 0.6820 (50% retracement) may push AUD/USD back towards the 0.6940 (78.6% expansion) area, with the next region of interest coming in around 0.7070 (61.8% expansion) to 0.7090 (78.6% retracement).
Disclosure: See the full disclosure for DailyFX here.


