AUD/USD, GBP/USD Present Two Different Ways To Approach The US Dollar
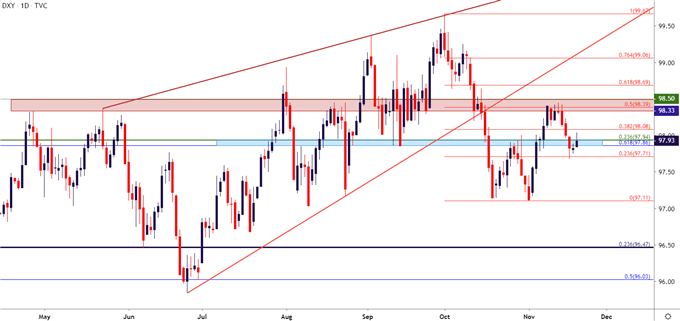
The US Dollar remains at an interesting spot on the chart. After starting Q4 with an aggressive sell-off in the month of October, the first half of November brought a retracement into the mix as the USD clawed back 50% of that previous bearish move. Resistance set-in at a familiar area on the chart and after bulls pulled back last week, prices fell to a fresh weekly low. This week has so far seen buyers coming back into the equation, albeit cautiously, as price action has pushed back-up to the 98.00 level in DXY.
US DOLLAR DAILY PRICE CHART
(Click on image to enlarge)

Chart prepared by James Stanley; US Dollar on Tradingview
At this point, directional biases on the US Dollar can prove as challenging. Will sellers continue to push similar to what showed in October? Or is the currency due for more gains as buyers re-enter the equation with a similar drive as earlier this year; when the USD continued to gain even as there were minimal threats of tighter policy from the Federal Reserve?
As I had shared in yesterday’s webinar, my bias is bearish around the USD, largely drawn from the longer-term look in the currency. DXY came into Q4 in a rising wedge formation and such backdrops will often be approached with the aim of bearish reversals. The month of October confirmed that thesis and potential remains for a deeper sell-off, particularly as the Fed appears backed-into-a-corner with which tighter policy isn’t even really an option.
Nonetheless, it would be imprudent to put all of one’s eggs in the short-USD basket, particularly as various major pairs appear more accommodative for USD-strength. As such, I’m continuing to follow AUD/USD for long-USD scenarios as the pair remains in a bearish state and a continuation of USD-strength, similar to what was seen earlier this month and again this week, could push the pair to fresh lows.
AUD/USD BEARS REMAIN IN-CONTROL
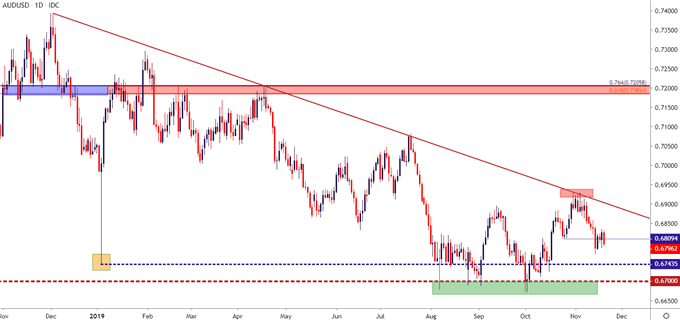
I’ve been following the short-side of the Aussie for some time now and a bearish trendline came in play as the page turned into November that remains of interest. This trendline is derived from swing highs in December of 2018 and April of 2019; the projection of which helped to cauterize the highs in July.
After that most recent trendline inflection, sellers have come back into the mix to push AUD/USD down to fresh lows.
AUD/USD DAILY PRICE CHART
(Click on image to enlarge)

Chart prepared by James Stanley; AUDUSD on Tradingview
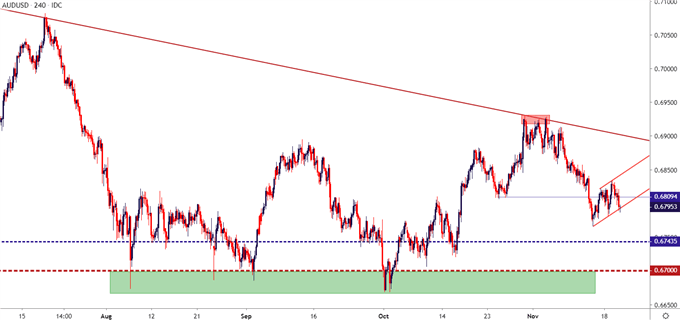
On the short-side target aspect of the matter, levels at .6743 and .6700 remain of interest, the former of which came into play as the ‘flash crash’ low from the beginning of this year. The latter level remains a bit more contentious, however, as this is around the fresh decade lows that were set in early-August and has yet to give way. The sub-.6700 support zone has now seen four separate tests, each of which have faltered thus far, as selling pressure has simply dried up below that key level on the chart.
This could be a scenario in which short-side AUD/USD setups could focus on secondary targets around that .6700 figure, at which point stops are adjusted to break-even and the remainder of the position is left open for short-side breakout potential.
AUD/USD FOUR-HOUR PRICE CHART
(Click on image to enlarge)

Chart prepared by James Stanley; AUDUSD on Tradingview
GBP/USD GLIMMERS BUT 1.3000 REMAINS IMPOSING
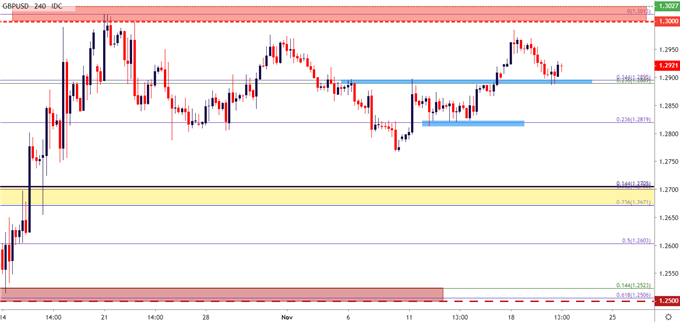
On the short side of the US Dollar, few pairs have been as active as GBP/USD, and this comes in stark contrast to the pair’s behavior earlier this year. A hard bearish trend ran into a key zone of support in early-August and, gradually, buyers began to re-enter the equation until prices posed a bullish breakout in October.
That breakout in GBP/USD ran all the way into the 1.3000 psychological level and after a couple of days of failed grind, buyers relented and price action fell back to 1.2800. As looked at yesterday, there’s been the build of a range-like backdrop in the pair with this imposing level of resistance lurking overhead. In that article, I also highlighted two potential support zones to investigate for bullish strategies, the nearest of which has come into play this morning while helping to hold the lows.
If USD-weakness is to come back into the equation, similar to what was seen in the month of October, the topside of GBP/USD remains of interest. Similar to the above with AUD/USD, the nearby resistance can serve to cap top-end profit targets, at least for now. Traders can incorporate that into their approaches by factoring profit targets up to the 1.3000 figure accompanied with break-even stops; so that if 1.3000 does come back into play, the bullish breakout could be worked with after the initial risk was removed from the position by nudging the stop above the entry price.
GBP/USD FOUR-HOUR PRICE CHART
(Click on image to enlarge)

Chart prepared by James Stanley; GBPUSD on Tradingview


