
- The AUD/USD forecast edges to the downside despite a hotter inflation print as the yields fell sharply, suggesting only a single RBA hike in the near term.
- Trump’s nomination of Kevin Warsh as the next Fed Chair lifts the US dollar, as markets view the decision as less dovish.
- COT positioning suggests reduced AUD longs, increasing odds for significant pullbacks.
The AUD/USD pair had a good start to the year, but it is clearly losing steam, trading well below recent highs around 0.7100. Strong domestic data has helped the Australian dollar, but positioning and external risks suggest it may not rise much in the near future.
Australian labor market data surprised to the upside, while inflation remains sticky. Trimmed mean CPI is running at 3.3% year-on-year, still above the RBA’s 2-3% target band and well above its November forecast of 2.7% by Q4. Markets currently price a 70-75% probability of a 25-bps rate hike at this week’s RBA meeting, which would lift the cash rate to 3.85%.
All major banks now expect tightening, although views differ on whether this marks a one-off move or the start of a short extension to the cycle.
However, market reaction to recent inflation data was telling. Australian three-year yields fell sharply after the CPI release, suggesting investors were positioned for an even hotter print. That raises the risk that a hike, if delivered, is treated as “one and done.” A surprise hold, even with hawkish guidance, would likely pressure AUD/USD in the short run.
On the other hand, the US dollar has rebounded following Donald Trump’s nomination of Kevin Warsh as the next Fed Chair, a move markets interpret as less dovish than expected. This lowers expectations for short-term US rate cuts, in line with solid US PPI data and the Fed’s cautious rhetoric. Asymmetric risk persists ahead of the ISM and NFP data. Any positive surprise could strengthen the dollar.
Meanwhile, large speculators have flipped net long AUD for the first time since late 2024, according to CFTC data, with gross longs close to multi-year highs. This crowding increases pullback susceptibility.
AUD/USD Technical Forecast: Wobbling Between 20 & 100 MAs
(Click on image to enlarge)
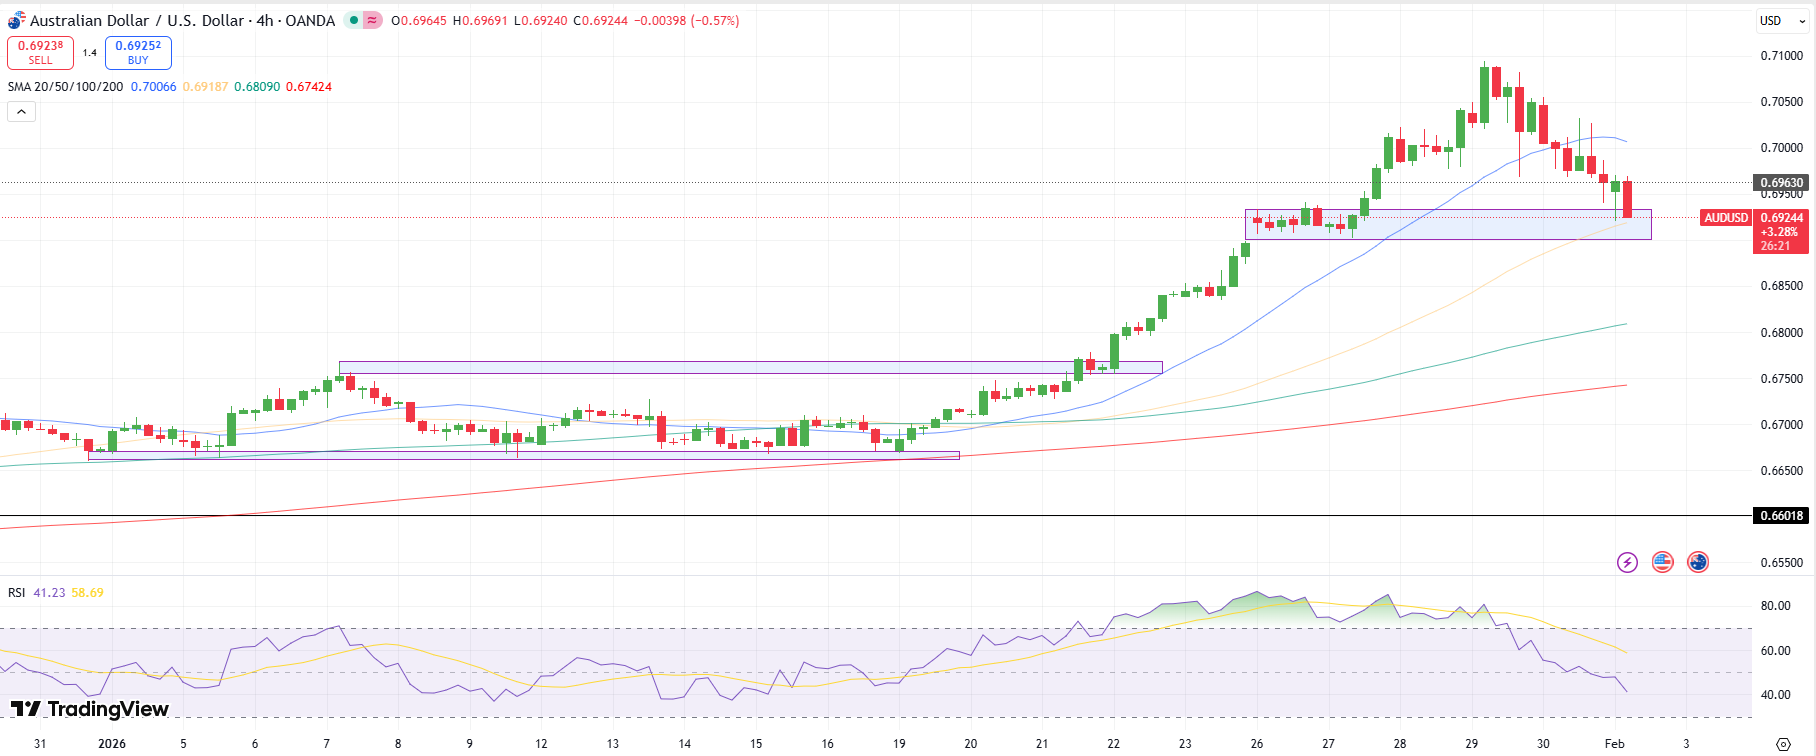
AUD/USD 4-hour chart
The AUD/USD 4-hour chart shows mild support near the order block at 0.6920, which aligns with the 50-period MA. However, the price is well below the 20-period MA near 0.7000, while the RSI has slipped below 50.0, suggesting a bearish bias.
In case of a bearish continuation, the pair needs a break below the 0.6920 area to find the next support at the 100-period MA near 0.6810. Conversely, the upside could face interim resistance around 0.6950 before 0.7000.
More By This Author:
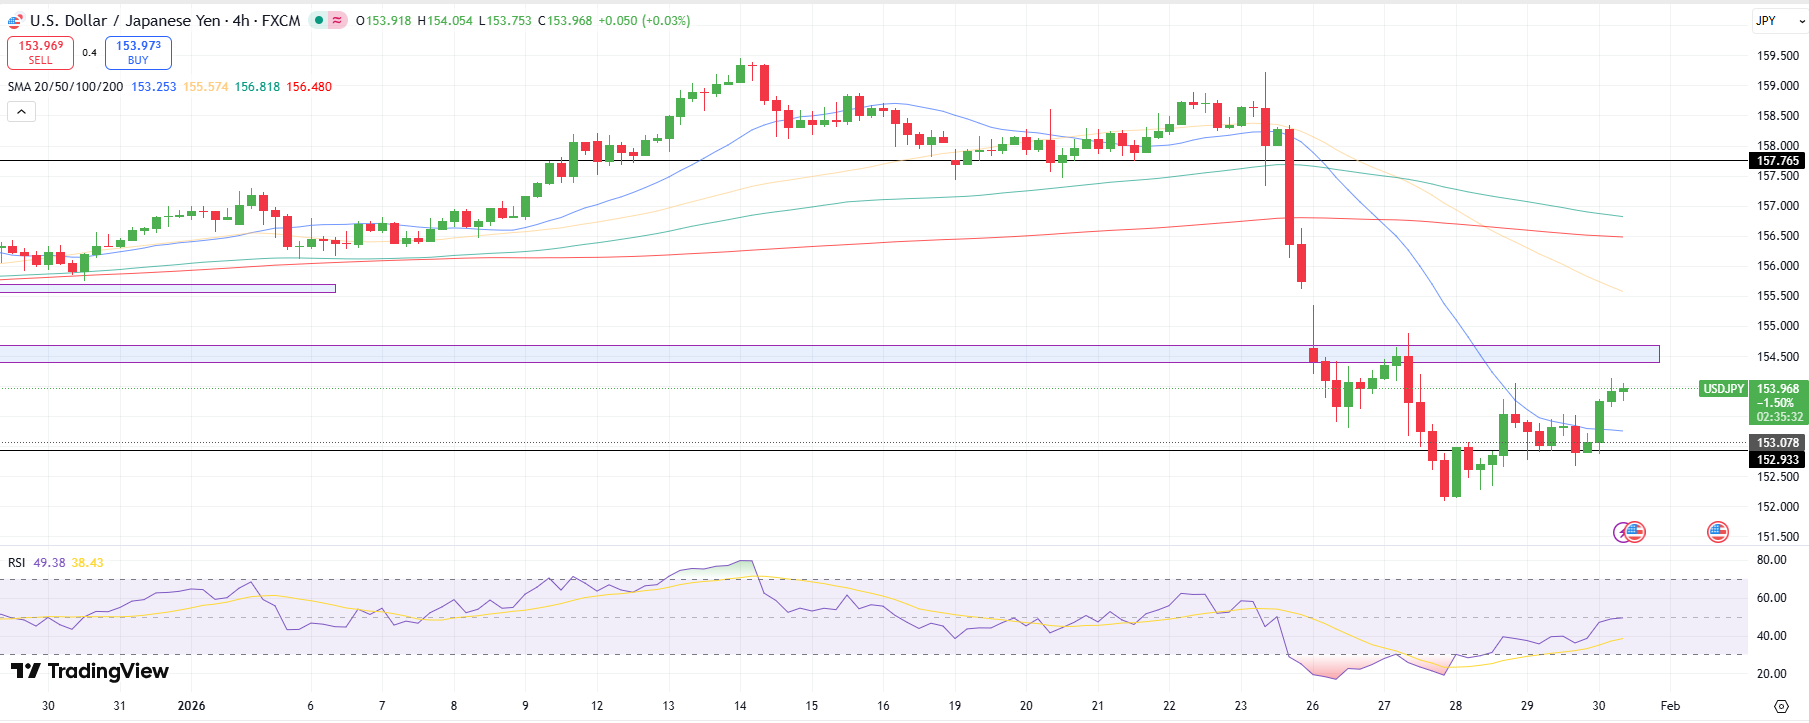
GBP/USD Weekly Forecast: Firm USD Risks Break Of 1.37, Eyes On BoE, NFPUSD/JPY Price Holds Firm As Markets Re-Price Fed And BoJ Expectations
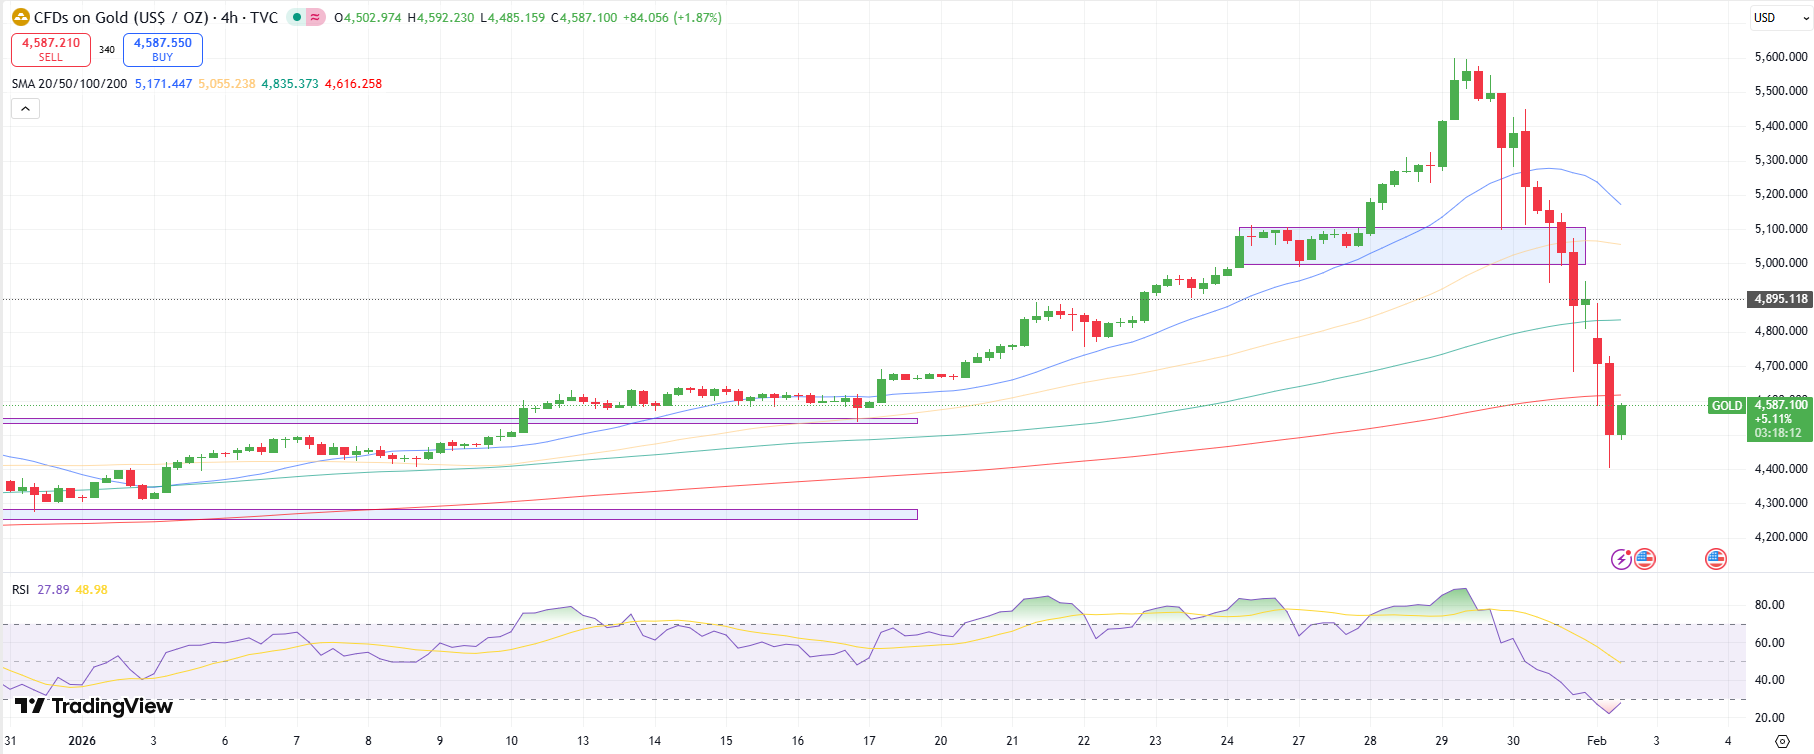
Gold Outlook: Strong Selling Amid Firm Dollar Ahead Of US PPI

Comments
Log in or sign up to join the conversation.