
AUD/USD Bulls Push The Bid From Key Support As USD/JPY Re-Tests 110.00
USD/JPY BACK TO 110.00 – CAN BULLS PUSH THROUGH?
After a rather troubling start to the year for the risk trade with a significant surge of Yen-strength showing at 2019 open, prices in the Japanese currency have continued to pullback for the past five weeks, and there’s been an increasing frequency of resistance tests in a key zone on USD/JPY that runs from 109.66-110.00. I had looked into this area last month, and even after a 150+ pip reaction to that resistance zone in the final week of January, buyers have continued to push, and price action is right back in that key area on the chart. This points to the possibility of continued gains, highlighting the 110.86 level on the charts, which is the 61.8% Fibonacci retracement of November 2017 to March 2018 major move.
USD/JPY FOUR-HOUR PRICE CHART
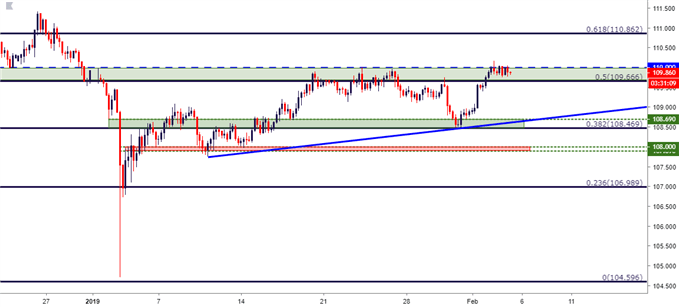
Chart prepared by James Stanley
AUD/USD BOUNCES FROM SUPPORT ZONE AFTER RBA: BUYERS CONSTRAINED BY BEARISH TREND-LINE
I had looked into AUD/USD yesterday as the currency had started to re-test a key zone on the charts. This area runs from .7185-.7205 with each of those prices coming from longer-term Fibonacci studies. Last night’s RBA rate decision appeared helpful to the bullish theme as prices put in a 50+ pip bounce from that support zone. Since then, buyers have been pulling back a bit, and resistance remains around a trend-line projection as taken from the January and February swing-highs. A topside break through this trend-line can re-open the door for longer-term bullish strategies in the pair.
AUD/USD TWO-HOUR PRICE CHART
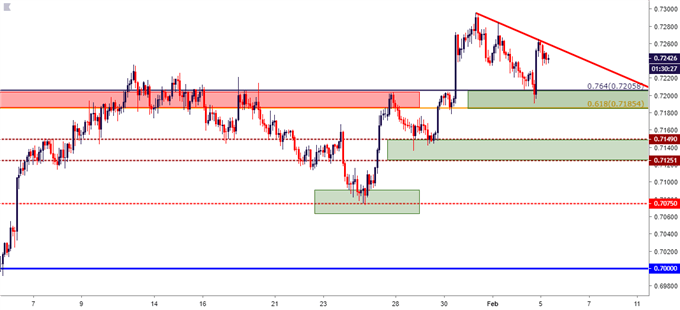
Chart prepared by James Stanley
GBP/USD: CABLE DROPS BELOW 1.3000 AFTER A VERY STRONG FOUR-WEEK RUN
Brexit remains a messy situation that could be difficult to prognosticate around, and traders in the British Pound are left with the possibility of looking at or for short-term trades off of support and resistance levels; the establishment of long-term trends with the overhang of Brexit can be a challenging projection at this point.
GBP/USD started the year with a nasty spill, quickly running down to establish a fresh 20-month low in the opening days of 2019. But since then, there has been a very noticeable change-of-pace, as buyers have re-grabbed control and continued to push even despite another leadership challenge for Theresa May’s PM seat. Over the past week, however, that bullish trend has started to pull back. Prices are now testing below the 1.3000 psychological level which had previously given a bit of resistance when the currency was surging higher last month. Will buyers show up to furnish some level of support anytime soon? Or, was last month an aberration driven by short-cover, re-opening the door for a return of the bears?
Level of relevance exist around 1.2920, as this is the 38.2% retracement of the January bullish move; and a key zone appears to exist in the area from 1.2828-1.2850. A bottom-side break below that prior support could soon re-open the door to bearish strategies in the pair.
GBP/USD FOUR-HOUR PRICE CHART
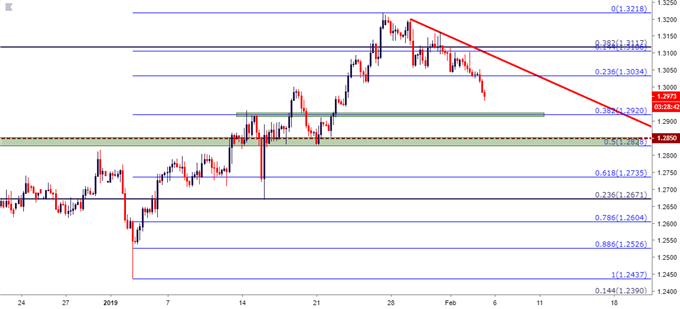
Chart prepared by James Stanley
Disclosure: Do you want to see how retail traders are currently trading the US Dollar? Check out our IG Client Sentiment ...
more

