
AUD/CHF: Breakout Expected To Lead To More Upside
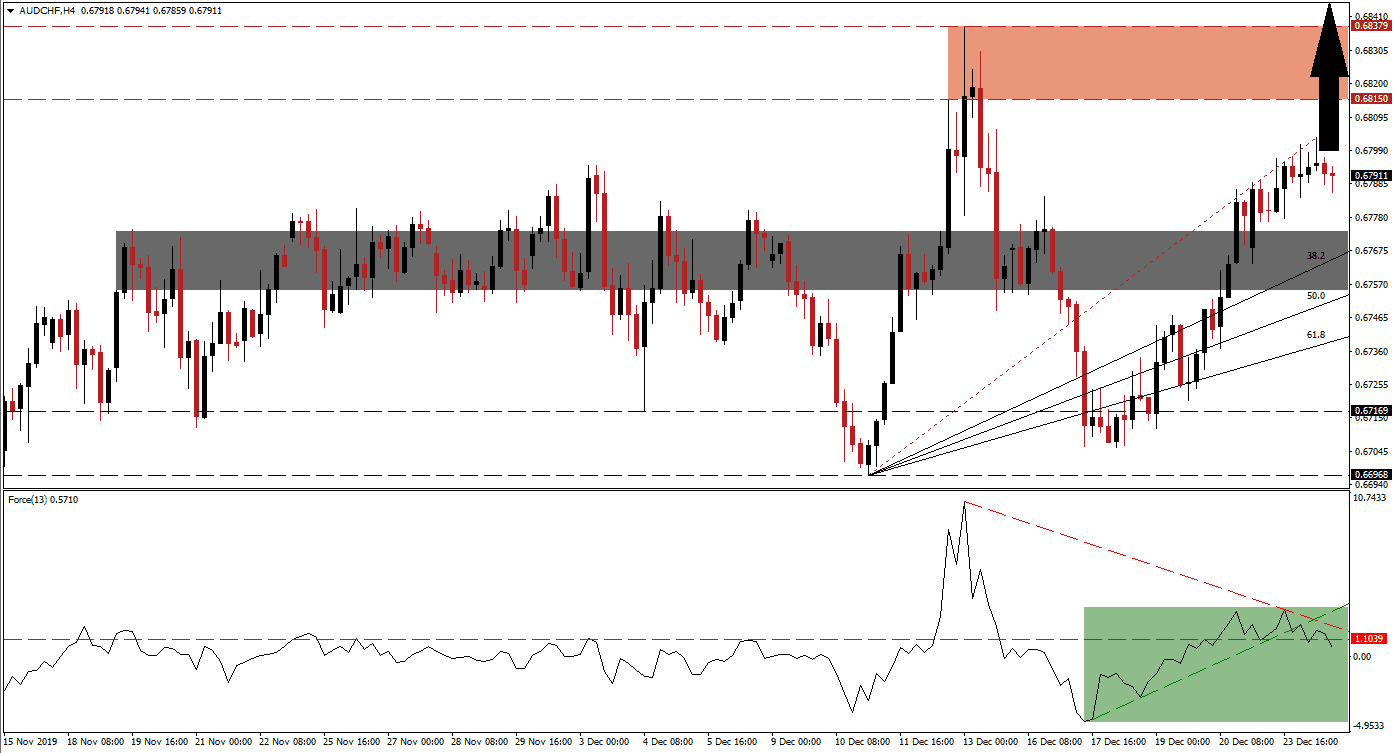
As equity markets extended their Santa Clause rally, the risk-on mood led to capital outflows from the safe-haven Swiss Franc. This allowed the AUD/CHF to accelerate to the upside after briefly venturing into its long-term support zone. Bullish momentum carried price action through its short-term resistance zone, converting it into support. The Fibonacci Retracement Fan sequence was redrawn to reflect the momentum change, but the advance temporarily paused following the breakout.
The Force Index, a next-generation technical indicator, recovered from a lower low together with this currency pair. After eclipsing its horizontal resistance level, bullish momentum stagnated and the Force Index retreated. A descending resistance level emerged and pressured this technical indicator back below its horizontal resistance level, as marked by the green rectangle. It additionally pushed the Force Index below its ascending support level, but it remains in positive territory with bulls in control of the AUD/CHF. A new advance is favored to follow.
Following the conversion of the short-term resistance zone into support, more upside is anticipated. This zone is located between 0.67551 and 0.67735, as marked by the grey rectangle. The preceding corrective phase resulted in a higher low, adding to bullish developments in the AUD/CHF. The Australian Dollar is the top Chinese Yuan proxy currency, and as the Chinese economy shows signs of stabilization, the long-term outlook for this currency pair suggests a continuation of the breakout sequence. You can learn more about a breakout here.
Price action is likely to be guided higher by its Fibonacci Retracement Fan. The existing gap between price action and this the ascending 38.2 Fibonacci Retracement Fan Support Level is anticipated to close through more highs, resulting in the redrawing of the sequence. This currency pair will face its next resistance zone between 0.68150 and 0.68379, as marked by the red rectangle. Given the higher low, a breakout above this zone is favored to result in a higher high for the AUD/CHF. The next resistance zone is located between 0.68881 and 0.69175.
AUD/CHF Technical Trading Set-Up - Breakout Extension Scenario
-
Long Entry @ 0.67900
-
Take Profit @ 0.69000
-
Stop Loss @ 0.67600
-
Upside Potential: 110 pips
-
Downside Risk: 30 pips
-
Risk/Reward Ratio: 3.67
Should the descending resistance level pressure the Force Index farther to the downside, the AUD/CHF may attempt a breakdown below its short-term support zone. Given the bullish fundamental outlook for this currency pair, the downside is anticipated to remain limited to its long-term support zone located between 0.66968 and 0.67169. Forex traders should consider this a great buying opportunity.
AUD/CHF Technical Trading Set-Up - Limited Breakdown Scenario
-
Short Entry @ 0.67300
-
Take Profit @ 0.67000
-
Stop Loss @ 0.67450
-
Downside Potential: 30 pips
-
Upside Risk: 15 pips
-
Risk/Reward Ratio: 2.00
Disclosure: DailyForex will not be held liable for any loss or damage resulting from reliance on the information contained within this website including market news, analysis, trading signals ...
more

