
AboveTthe 40 – A Suspect Breakout For The S&P 500
AT40 = 52.7% of stocks are trading above their respective 40-day moving averages (DMAs)
AT200 = 56.7% of stocks are trading above their respective 200DMAs
VIX = 11.8
Short-term Trading Call: neutral
The stock market is not quite out the (short-term) woods yet. Last Wednesday I pointed out why the latest bearish divergence forced me to back down from my cautiously bullish short-term trading call. My neutral stance reflected a fresh wariness over an S&P 500 (SPY) grinding higher without the confirmation of a higher AT40 (T2108), the percentage of stocks trading above their respective 40-day moving averages (DMAs).
The S&P 500 (SPY) proceeded to bolt higher on Thursday to a fresh all-time high with a close that stretched above its upper Bollinger Band (BB). AT40 traded higher along with the S&P 500, but my favorite technical indicator failed to break out from its two week range which itself is at the bottom of a 5 month range. The stretch above the upper-BB was enough to prevent me from chasing the S&P 500 against my change in short-term trading call. The lack of confirmation from AT40 sealed the deal and even increased the risk for an imminent pullback by my calculation.
On Friday, the S&P 500 (SPY) pressed higher intraday only to fade to a slightly lower close. AT40 broke out and then faded right back into its trading range. With a Federal Reserve meeting as a potential catalyst, I go into the coming week wary of the next short-term pullback.
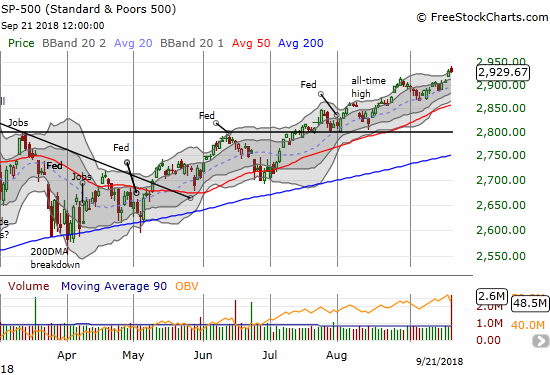
The S&P 500 is stretching higher on an apparent march toward 3000. However, lately, trading action at the upper Bollinger Band (BB) tends to proceed small pullbacks.
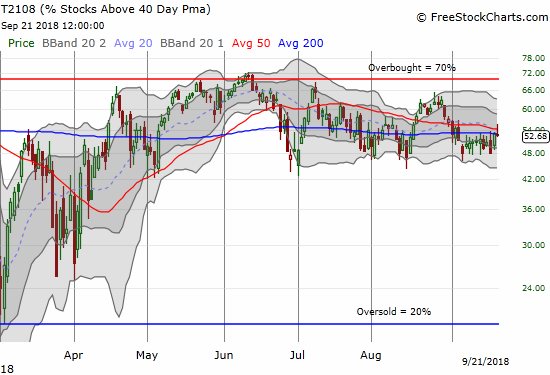
AT40 (T2108) is making no progress and suggests that just a few key stocks/sectors are cajoling the S&P 500 higher these days.
In an on-going change of fortunes, the tech-laden NASDAQ and Invesco QQQ Trust (QQQ) are lagging the S&P 500. Both indices last hit all-time highs almost a month ago. Tech stocks have been unable to regain momentum since then even though the uptrending 20 and 50DMAs continue to guide tech stocks.
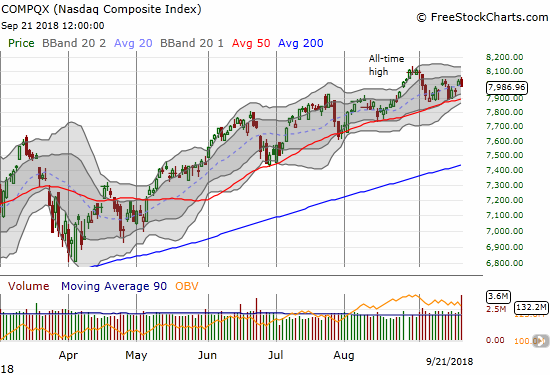
The NASDAQ is stuck in a 2-week trading range pivoting around the uptrending 20DMA and guided by uptrending 50DMA support.
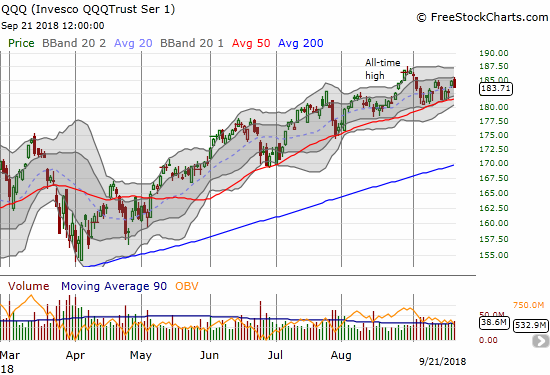
The Invesco QQQ Trust (QQQ) is following the pattern of the NASDAQ.
The volatility index, the VIX, remains a very interesting part of the stock market’s divergent behavior. The VIX ended a down week at 11.7, just above recent lows and just above the 11 level which marks “extremely low volatility” (ELV). This level of complacency underlines the market’s overall bullish mood. It also makes portfolio protection very cheap. October is the last month of the year that includes a history of danger for the stock market, so it makes sense to load up on the “bargains” on SPY put options and long volatility trades. Since I am not (yet?) bearish, I chose with the long volatility trade. I bought yet another tranche of ProShares Ultra VIX Short-Term Futures (UVXY) call options at the same time I let the last tranche wither away to nothingness.
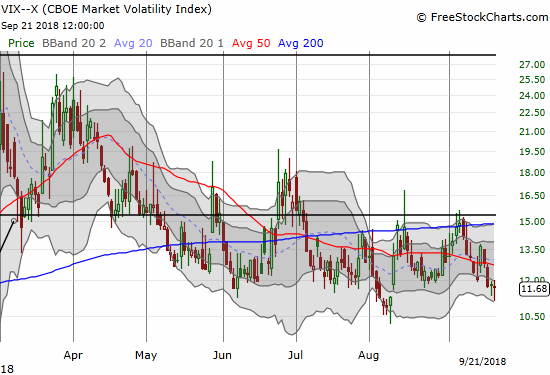
The volatility index, the VIX, made a little more progress toward challenging the recent lows.
A falling U.S. dollar index is helping the bullish mood by offsetting the negative impact of trade tensions on stocks with international sensitivities. There is likely a virtuous circle going on as the (surprisingly) positive response to heightening trade tensions is taking steam out of the dollar. A lower dollar is helping boost the outlook beyond U.S. borders. Commodity-related stocks were on fire (I clearly sold my call options on BHP Billiton (BHP) too early) and emerging market currencies did very well.
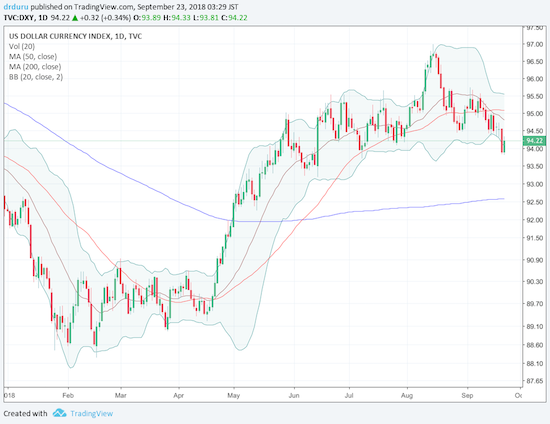
Source: Trading View
The U.S. dollar index (DXY) confirmed a 50DMA breakdown. Its 20DMA is now in a downtrend.
The dollar weakened despite a fresh surge in long-term interest rates. The iShares 20+ Year Treasury Bond ETF (TLT) sold off hard this week and allowed me to take profits on my last tranche of TLT puts. Still, if I am to believe the other signals in the market, long-term rates are not going much higher from here, and the Federal Reserve this coming week is set to reassure markets about future monetary tightening. If instead the news upsets the market, I will pounce on fades of many of the trades that assumed otherwise.
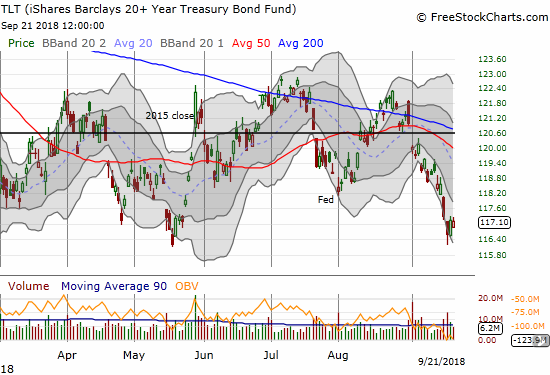
The iShares 20+ Year Treasury Bond ETF (TLT) stopped cold at its 2018 low. Is support holding up for a triple bottom?
CHART REVIEWS
Apple
AAPL has stalled out. As usual, new product news served as a selling moment for short-term traders who revel in selling the news. After Thursday’s intraday low dipped AAPL to a 3-week low, the week ended right at the September closing low. AAPL’s anchor has helped weigh on the tech-laden indices.
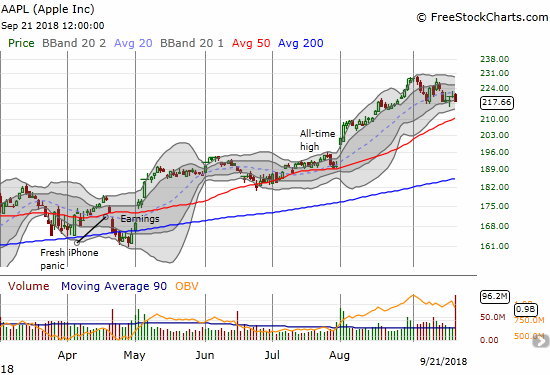
Apple (AAPL) is faltering. A 50DMA test looks imminent.
Amazon.com
AMZN is also weighing on the tech indices. Last week it managed to close below its uptrending 20DMA which is now capping the stock. AMZN last closed this many days below its 20DMA back in April. The uptrending 50DMA now stands as support. If that support fails, selling may not end until the 1750 level where AMZN ended its last small pullback. My recent attempts to trade a rebound in AMZN have largely fizzled.
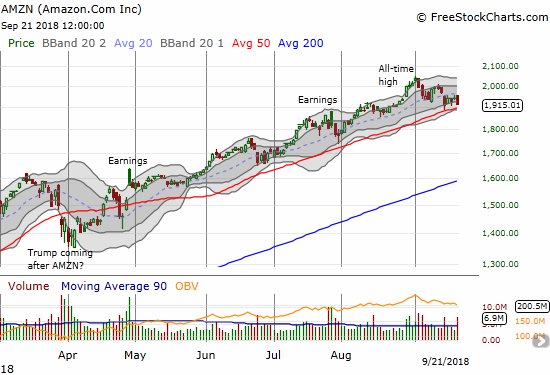
Amazon.com (AMZN) is slumping in September but the 50DMA is still holding as support.
Autozone
AZO gapped down 5.0% post-earnings, well below its 50DMA and lower-BB. Despite my on-going bullishness on the auto parts sector, I did not think to play a bounce from such over-sold conditions. The next day, AZO finished closing the gap and ended the week already looking ready to challenge its all-time high.
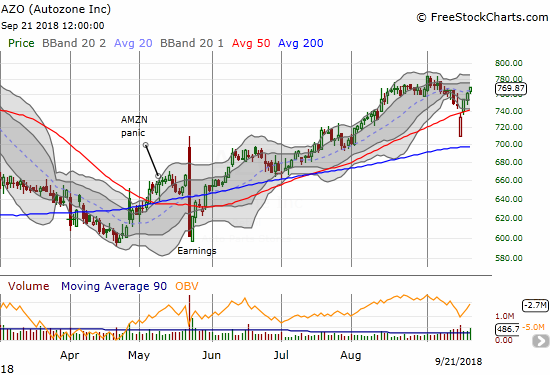
Autozone (AZO) bounced back sharply from a 50DMA breakdown.
O’Reilly Automotive
ORLY reported earnings on July 25th; the news helped the stock keep motoring higher. ORLY was in the middle of a mild pullback when AZO reported earnings. ORLY gapped down slightly in sympathy with AZO in a move that clearly exhausted the remaining sellers
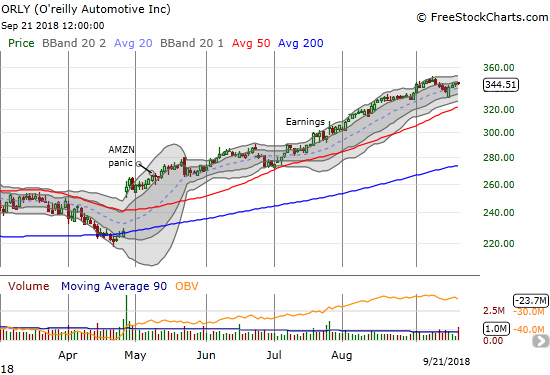
O’Reilly Automotive (ORLY) is warming up its uptrend after a slight hiccup.
Kroger
With the Amazon Panic long forgotten, KR enjoyed a strong recovery and fresh run-up. Ahead of its latest earnings, KR even managed to print a new high for the year. The latest grace period for the grocer came to an end with a large post-earnings gap down. KR closed the last week right at 50DMA resistance. KR seems to be a stock to buy on the dips. I missed this last swing, but I will keep a closer eye on it.
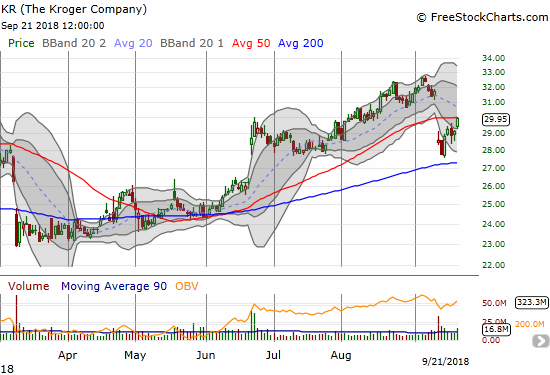
Kroger (KR) is bouncing back from a post-earnings 50DMA breakdown.
Netflix
NFLX threw me for a loop last week. I well anticipated a 50DMA breakdown and held onto my put spread in anticipation of follow-through selling. I neglected to notice the Emmy’s were airing that night. NFLX tied HBO for the most Emmy’s and ended HBO’s 17-year reign alone at the top. The stock promptly soared the next day. I quickly gave up on the put spread and bought a call spread on Wednesday as the stock marginally broke out. I am not sure how much these awards really matter since the 2018 version of the Emmy’s show set a new ratings all-time low. NFLX now looks ready to retest its 50DMA.
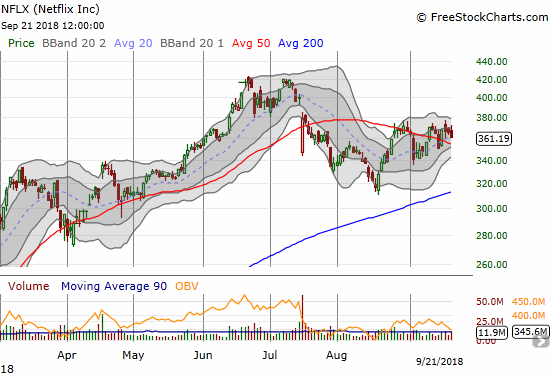
Netflix (NFLX) is churning with an uptrending 20DMA still providing support.
Whirlpool
I bought WHR puts as a hedge against bullish positions. In expiration week it went from one of my best trades to worst. WHR opened the week with a loss and the puts suddenly priced in the risk of a much deeper loss. I decided to sit on the position. On Tuesday the stock gapped up and the puts were never the same. I continued to sit on the puts as a hedge and ended up watching them fade away much faster than I anticipated. I reloaded on puts with an October expiration.
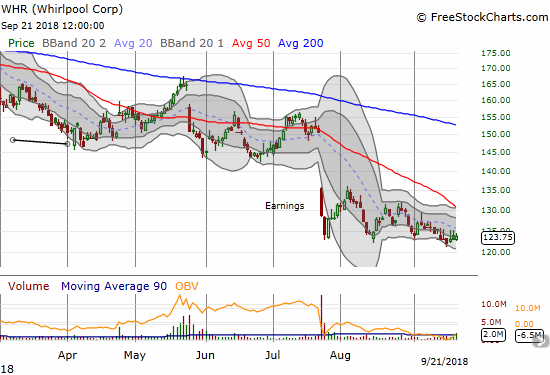
Whirlpool (WHR) is lingering at a 5+ year low.
Yelp
YELP broke out as I had hoped. With my call options expiring, I took profits on the first breakout and missed the additional move on Thursday. The stock still looks bullish.
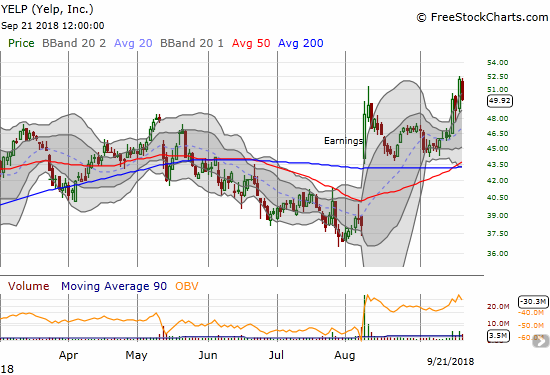
Yelp (YELP) broke out to a new 3 1/2 year high.
Zillow (Z)
Zillow (Z) closed the week near a low for the year. The recent weakness has come in large chunks. Friday’s 4.2% loss allowed me to get residual value from my put options leftover from the success of my Redfin (RDFN) versus Zillow pairs trade. With RDFN suddenly falling again (off 10% from its post-earnings recovery high), I will turn the crank on this trade one more time.
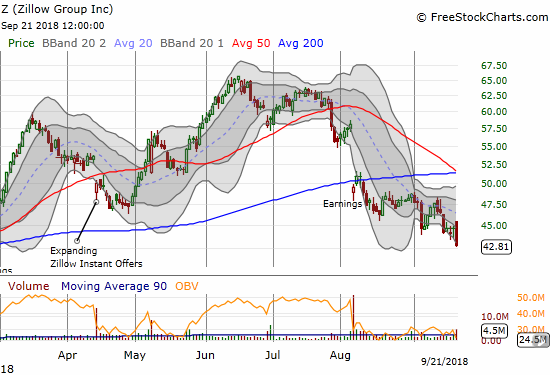
Zillow Group (Z) lost more ground this week and closed at an 8-month low.
“Above the 40” uses the percentage of stocks trading above their respective 40-day moving averages (DMAs) to assess the technical health of the stock market and to identify extremes in market sentiment that are likely to reverse. Abbreviated as AT40, Above the 40 is an alternative label for “T2108” which was created by Worden. Learn more about T2108 on my T2108 Resource Page. AT200, or T2107, measures the percentage of stocks trading above their respective 200DMAs.
Active AT40 (T2108) periods: Day #149 over 20%, Day #118 over 30%, Day #113 over 40%, Day #2 over 50% (overperiod), Day #16 under 60% (underperiod), Day #69 under 70%
Daily AT40 (T2108)

Black line: AT40 (T2108) (% measured on the right)
Red line: Overbought threshold (70%); Blue line: Oversold threshold (20%)
Weekly AT40 (T2108)

Disclosure: Full disclosure: long AAPL calendar call spread, long AMZN call, net long US dollar, long WHR puts, long UVXY calls
Follow Dr. Duru’s commentary on financial markets ...
more

