
A Little Euphoria?
The bears had an opportunity to start correcting the uptrend that started at 2000 on June 27 which was, by the way, the two-day 113-point bottoming action of a 20-wk cycle. But seasonality and other causes kept this 20-wk cycle from fully extending and made it bottom with the shortest span since 12/14.
Furthermore, the bulls rubbed salt in the wound by sending SPX soaring nearly seventy points in four trading days. To say that this seems a little excessive at this stage of the advance, is probably an understatement. Each day, the market had a gap opening which remained unfilled. But the most interesting part of this market activity is that each day the A/Ds (which opened with a 1200 to 1500 positive differential) immediately started to retrace the majority of that advance in the first hour of trading -- once to neutral and once to slightly minus-- before recovering partially for the rest of the day. I believe that this can only mean that smart money has been selling at each opening and, although it is unlikely that the index is making a climactic top in the beginning stages of an important cycle, it indicates that a correction will take place before prices can progress much higher.
What was thought to have been a distribution pattern turned out to be a re-accumulation phase which has given us a pretty good idea of how far this move will carry, and the first four days have already used up a good portion of that count. It also seems logical that the current wave pattern cannot extend forever without an overdue correction of appropriate degree. So, one should, at a minimum, be a little suspicious of all this exuberance. Caveat emptor.
Chart Analysis (These charts and subsequent ones courtesy of QCharts)
SPX daily chart
The chart shows how the market has begun to move exponentially since the low of the 40-wk cycle (dashed red line), and how the action of the SPX over that past four days has taken it to the very top channel line of the large channel which encompasses the price trend since the 1810 low of 02/11/16 --which was also the 7-yr cycle low. Perhaps it was the passage of the tax bill in conjunction with seasonality which truncated the size of the decline normally associated with the 20-week cycle, as well as its span. The pattern on the chart is even smaller than that caused by the bottoming of the 80-day cycle about six weeks earlier.
Lesser channels have also been drawn using different colors, with their top line represented in dashes. The dashed lines are converging just above the current price level and it is a well-documented fact that channel tops usually form points of resistance from which price retraces. On that basis alone, some sort of a pull-back should be expected. That, plus the fact that the market, by any measurement, is over-extended. In addition, the behavior of the advance/decline ratio, as noted above, has to be suspicious and probably represents distribution, even though the price does not yet reflect it with a congestion pattern.
Nevertheless, it is unlikely that any correction, however severe it might be over the near-term will be long-lasting. Perhaps we are only entering a volatile period which will in fact create a congestion period that, this time, will be a genuine distribution pattern, signaling a larger correction. We should also take note that a move to the top of a channel, while it denotes an overbought condition, is rarely the end of a trend, since it does not show any kind of price deceleration.
The strength of the index during the first week of the new year has lifted the two momentum oscillators and nullified all previous negative divergence. Not so with the A/D oscillator at the bottom of the chart which continues to underperform the market.

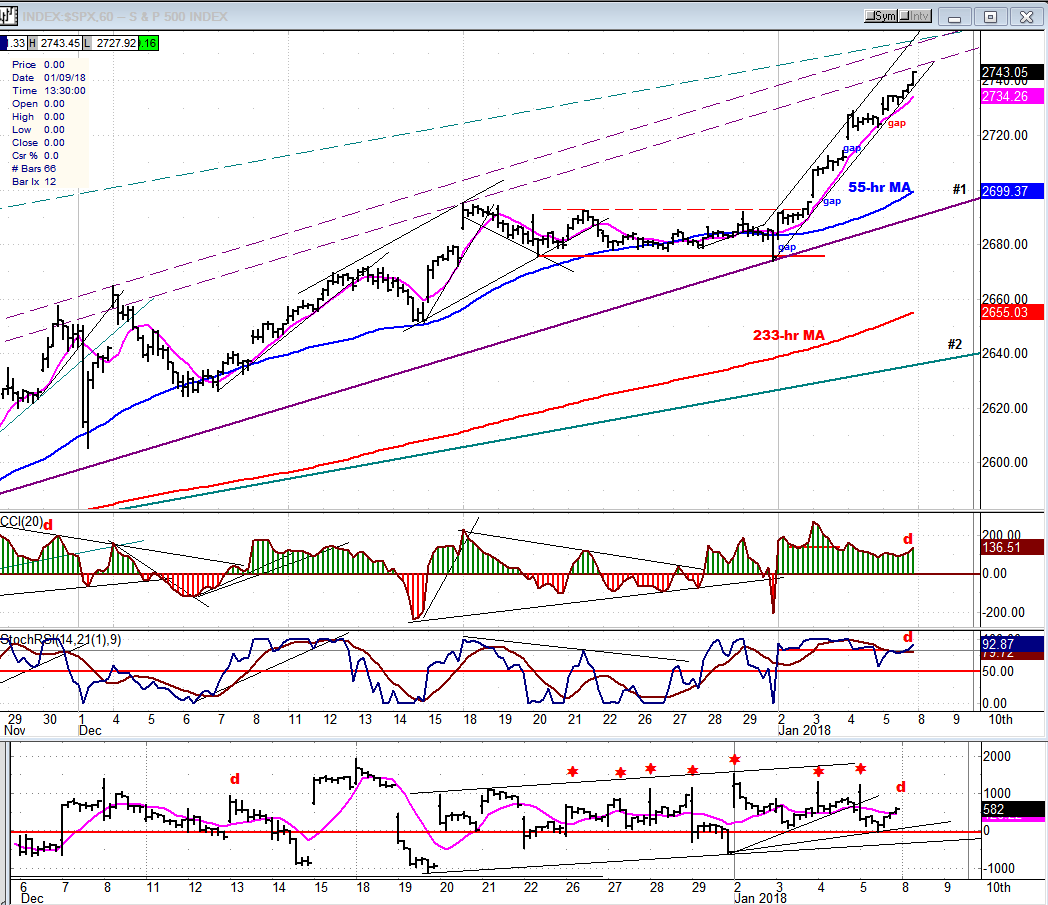
SPX hourly chart:
Steep channel lines are drawn for the uptrend of the last four days. It makes for a very narrow, very steep price channel which is characterized by four consecutive gap openings. I have marked the last gap in red, because I believe the first one was a break-away gap; the next two continuation gaps, and the last one an exhaustion gap. Note how, since then, the price has remained inside the channel, but crawled along the lower line. This clearly represents deceleration of the near-term trend with some short-covering ahead of the week-end causing a little more exuberance in the last half-hour of trading. A potential short-term target to 2743 was also reached at the close.
The two upper (momentum) oscillators show some clear weakness at the end of the week with negative divergence appearing in both. But, as mentioned earlier, the most interesting index is the lowest one which is simply an hourly plot of the difference between advances and declines. The red asterisks mark the first hour of trade and you can see that in all cases, this was the high of the day with the biggest retracements occurring on Friday, when the index reflected instant selling and, by the fourth hour, actually went slightly negative while prices remained lofty. There was a little recovery over the last three hours, but the A/Ds remained very weak relative to the price advance.
The same pattern also formed during the last four days of the year just ahead of the cycle low, and ended with an eleven-point drop in the last hour. I suspect that a similar price retraction will soon take place, perhaps as early as Monday morning.
An overview of some important indexes (daily charts)
I have re-shuffled my leading indexes in order to get a better perspective on what the market is doing. In the top row, I have the 5 FAANGs (Facebook, Apple, Amazon, Netflix, and Google). In the bottom row are four that have consistently proven themselves historically: SMH, IWM, TRAN, XBD.
In the top row, Apple is the laggard, but there is plenty of strength left in the other four which just easily attained new highs. In the bottom row, SMH (semiconductors) and IWM are lagging. TRAN and XBD are still doing fine.
When they all show topping behavior, it should be time to look for a significant market correction.

UUP (dollar ETF)
UUP has made another correction low, but appears to be stabilizing for what may be nothing more than a bounce in a downtrend. Nothing really bullish about this chart.

GDX (Gold miners ETF)
After responding to its nest of cycle lows with a strong rally, GDX has been consolidating for a week as it reached a resistance level. Some of the lesser cycles are about to bottom, but they are still far enough away to allow for the index to complete its initial break-out wave to 24.00 or higher. After this completion, it should have a longer consolidation period into the next cycle lows.

USO (United States Oil Fund)
USO is following the intended script and has pushed to a new recovery high which could still extend a little further to 12-50-13.00.

Summary
While the action of SPX for the past week is clearly excessive at this stage of its uptrend, it is only suggestive of a period of volatility ahead as it forms a congestion top while reaching the projection target generated by the last period of re-accumulation.
Current Position of the Market
SPX: Long-term trend – The bull market is continuing with a top expected in the low 3000s.
Intermediate trend – A short-intermediate term top is re-forming at a higher level!.
Analysis of the short-term trend is done on a daily basis with the help of hourly charts. It is an important adjunct to the analysis of daily and weekly charts which discusses the course of longer market trends.
Analysis of the short-term trend is done on a daily basis with the help of hourly charts. It is an important adjunct to the analysis of daily and weekly charts which discusses the course of ...
more

