
Ethereum And Dash Elliott Wave Analysis
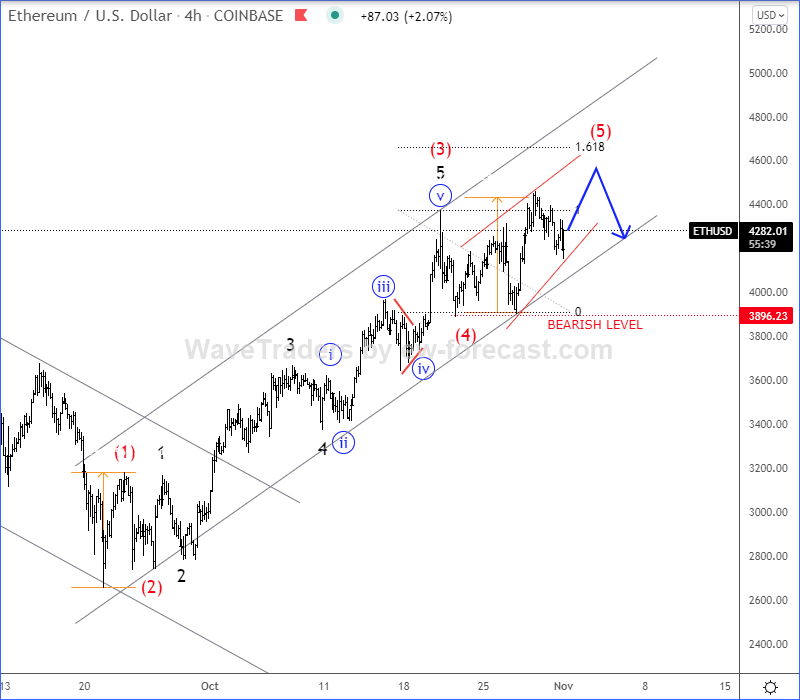
Ethereum is back to highs, but still into key resistance 4300-4500 resistance area around all-time highs in the 4-hour chart, so seems like wave (5) can be now approaching the end, ideally as part of an ending diagonal (wedge) pattern with room up to 4500-4700 levels.

Image Source: Pixabay
However, any earlier sharp or impulsive decline back below the channel support line and 3900 regions would be a signal for the top.
Ethereum 4h Elliott Wave Analysis
(Click on image to enlarge)
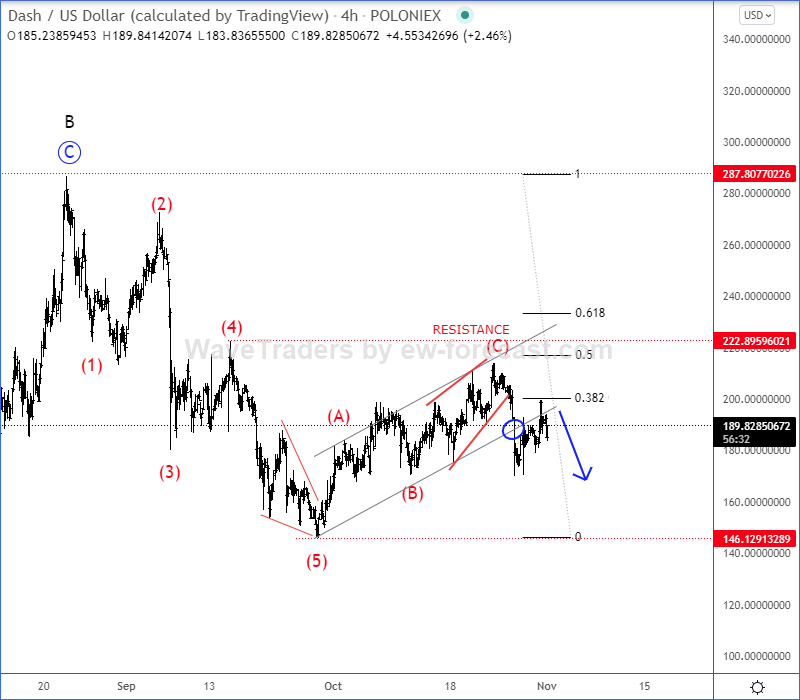
Dash turned sharply down from projected resistance in the 4-hour chart after we noticed an A-B-C corrective rally. So, now that is breaking below channel support line, we have to be aware of more downside pressure in upcoming days which can send the price down below 146 region and lower, but considering other bullish looking major cryptocurrencies, maybe after a sideways price action in case if it's forming a bearish triangle pattern.
Dash 4h Elliott Wave Analysis
(Click on image to enlarge)
Disclosure: Please be informed that information we provide is NOT a trading recommendation or investment advice. All of our work is for educational purposes only.


