
Bitcoin Bounces Right Off Key Support That May Be The End To Current Correction
Bitcoin (XBT/USD) has rallied a little over 30% since bouncing off support of the second cumulative average ($9,260) indicator (black) that was noted in our analysis from the other day, January 13. The low of the current correction was roughly $9,209 (depending on your data source). At that point, bitcoin had fallen a little over 50% below the all-time high of around $19,666 hit five weeks ago. The recent decline also completed a 61.8% Fibonacci retracement nearby at $9,349, as measured from the uptrend starting at the September 2017 swing low.
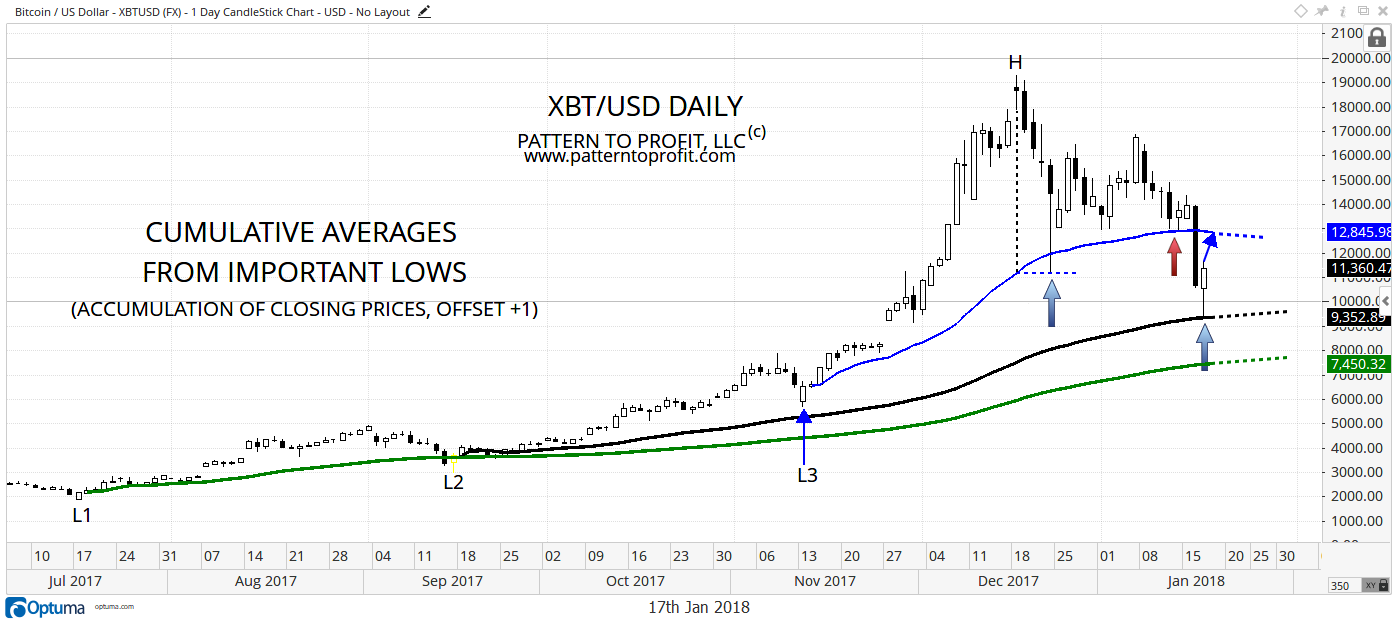
Given bitcoin's recognition of cumulative averages historically and other proprietary analysis, there is now a good chance that the recent low may be a major low. If correct, weakness should be used to accumulate as the possibility of an eventual continuation of the long-term uptrend has improved.
If rather, the $9,209 low is exceeded to the downside then the next target becomes the lower cumulative average price support zone (green). That price zone would be from approximately $7,700 to $7,500.
Disclosure: Pattern to Profit, LLC, any affiliates or employees or third party data provider, shall not have any liability for any loss sustained by anyone who has relied on the information ...
more

