
Bitcoin And Ethereum Elliott Wave Analysis: More Weakness Ahead
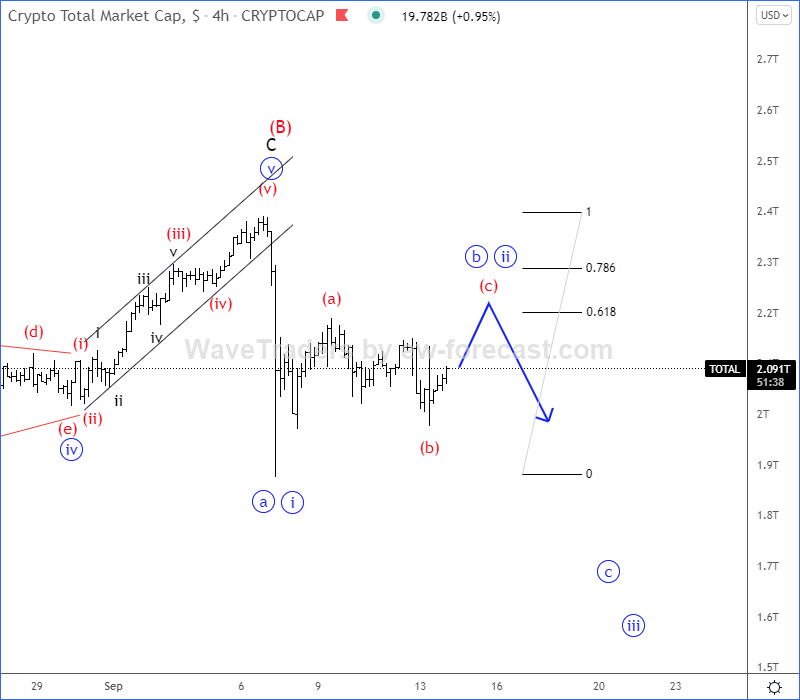
Crypto total market cap looks like it's trading in an (a)-(b)-(c) flat correction of wave "b"/"ii", so we may see some intraday recovery, but probably temporarily only as subwave c) can be now in play that can find the resistance around 61,8% - 78,6% Fibo. retracement and from where we should be aware of a bearish continuation within wave c or iii.

Image Source: Pixabay
Crypto Total Market Cap 4h Elliott Wave Analysis Chart
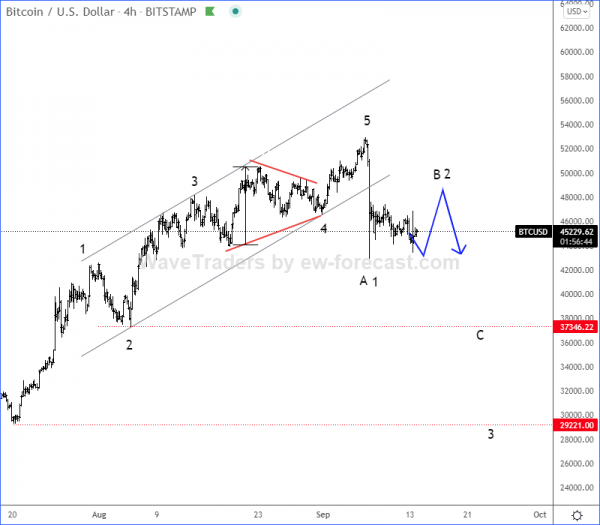
Bitcoin, BTCUSD turned sharply down from projected and important resistance zone in the 4-hour chart, so seems like the five-wave cycle is completed and we can now expect a reversal at least in three waves A/1-B/2-C/3 and least back to 37k area for C of a correction, if not even lower towards 30k for wave 3 of a new five-wave bearish impulse.
Bitcoin 4h Elliott Wave Analysis Chart
Ethereum, ETHUSD turned sharply down in the 4-hour chart after we noticed the 5th wave and completed the five-wave cycle. So, after that break below the channel support line, seems like a new minimum three-wave decline can be now in play at least back to 2400 area for wave (C) if not even lower towards 1700 area for wave (3).
Ethereum 4h Elliott Wave Analysis
Disclosure: Please be informed that information we provide is NOT a trading recommendation or investment advice. All of our work is for educational purposes only.


