
Crypto Chartbook: Bitcoin, The Real Move Is Still Ahead
Looking at Bitcoin’s history, it tells the typical story of expansion. When something new is introduced to the world, it is immediately met with doubt. Often ridiculed and even fought against. The mass population is fearing for their status quo and very afraid of change in general. Bitcoins’ story is no different. Bitcoin, the real move is still ahead.
BTC-USD, Monthly Chart, The ladder of success:
(Click on image to enlarge)
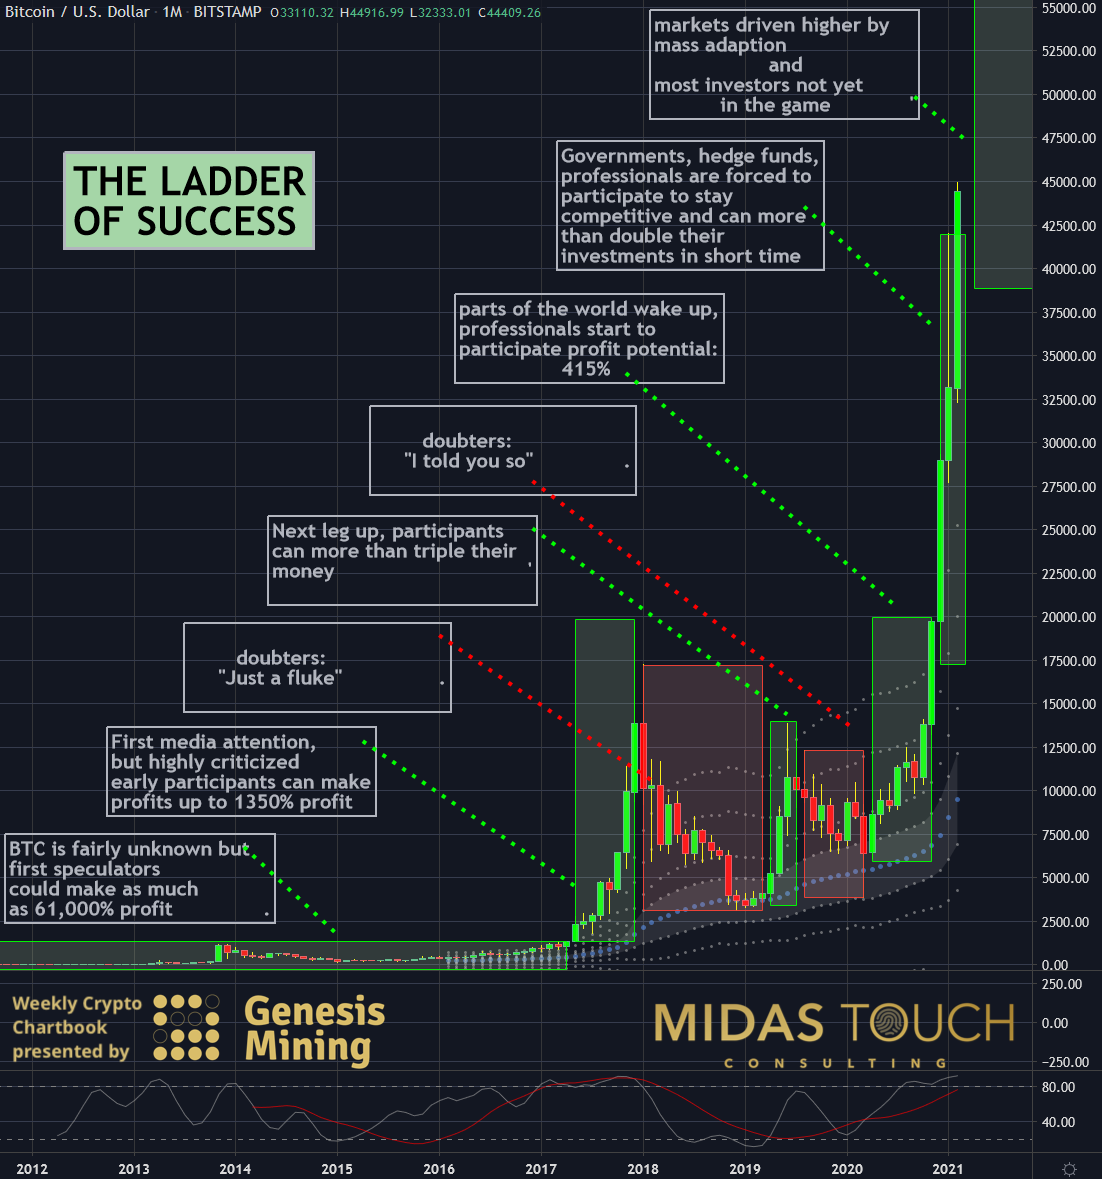
BTC-USD, monthly chart as of February 9th, 2021
A part of this story is that those who fear and fight progress, on the other hand, are curious and would like to see some profits for themselves but can’t bring themselves to participate. In the monthly chart above, we can see profit potentials in each time segment illustrated by the percentage.
While doubters try to be right, those who take risks make money. Not every story is a success story, but Bitcoin´s past, present, and in our opinion, future as well is more than rosy.
BTC-USDT, Daily Chart, The runaway train:
(Click on image to enlarge)
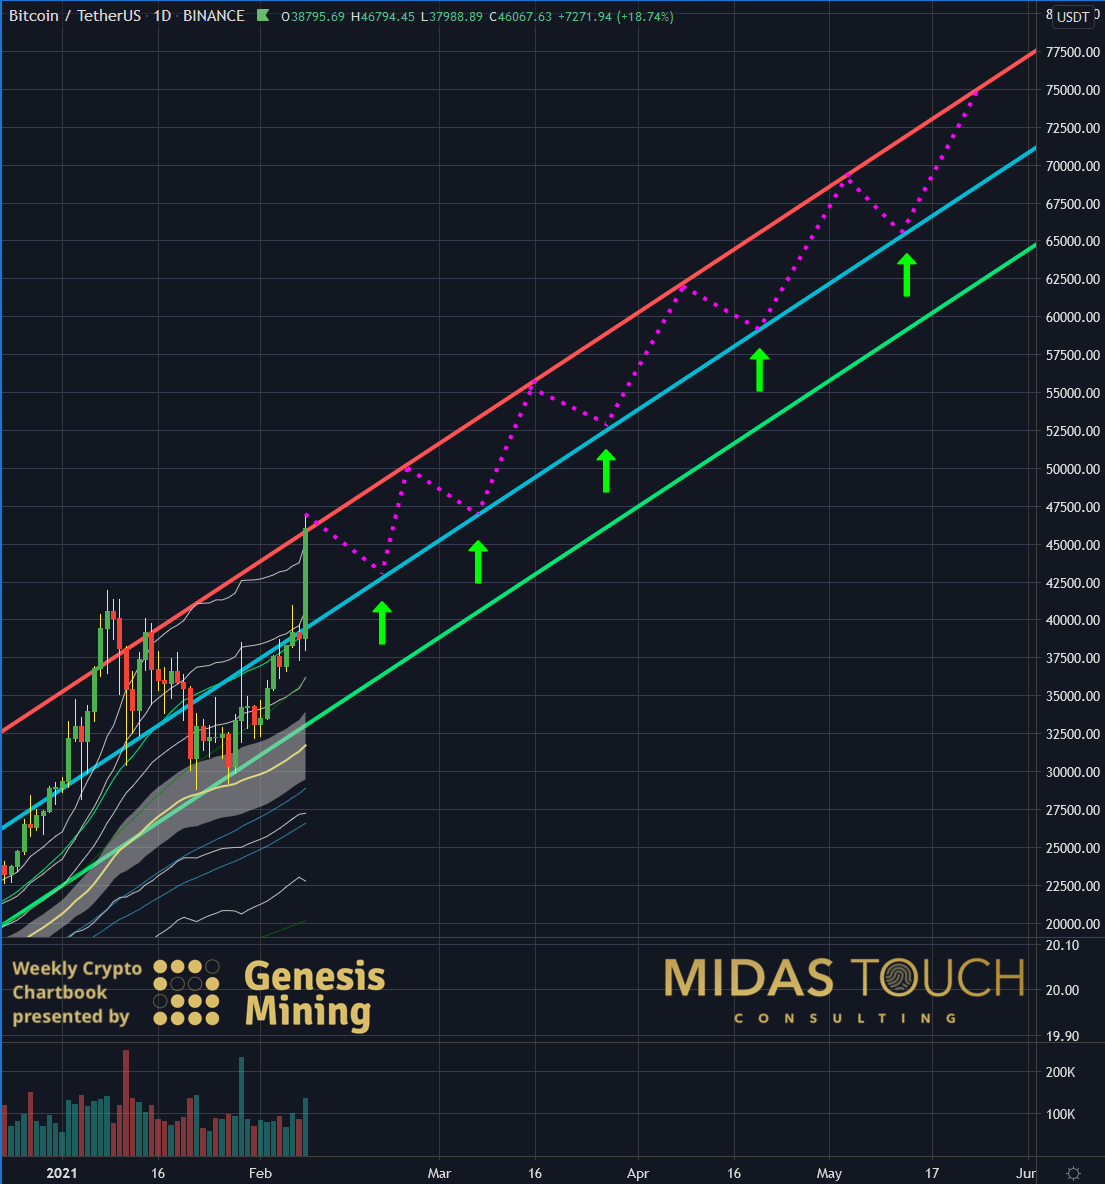
BTC-USDT, daily chart as of February 9th, 2021
In each of these success stories comes one specific point that has its tricky part from a psychological perspective and, as such, an extra hurdle on how to participate in a market at that particular point of the trend.
When advancements seem overbought, but the critical mass of investors is not yet on board, the supply is limited, and peer pressure in the professional market-making forces governments, institutions, hedge funds, banks, and so forth to participate to have a core holding. Everybody hopes for a retracement to get into the move with relatively low risk, but prices join the runaway train.
At this point, prices seem already high compared to their origin and the steepness of the trend, but investors often wake up 5-10 years later and can’t believe they didn’t join the party with prices up to higher levels.
We recommend to take aggressive entries on smaller time frames and reduce the risk factor by trading small position size. Due to the use of our quad exit strategy and letting runners run and transfer to higher time frames, one can still build a sizeable position over time.
The daily chart above depicts such a train entry scenario with entry points at the midline of a linear regression channel.
BTC-USDT, Monthly Chart, Bitcoin, the real move is still ahead:
(Click on image to enlarge)
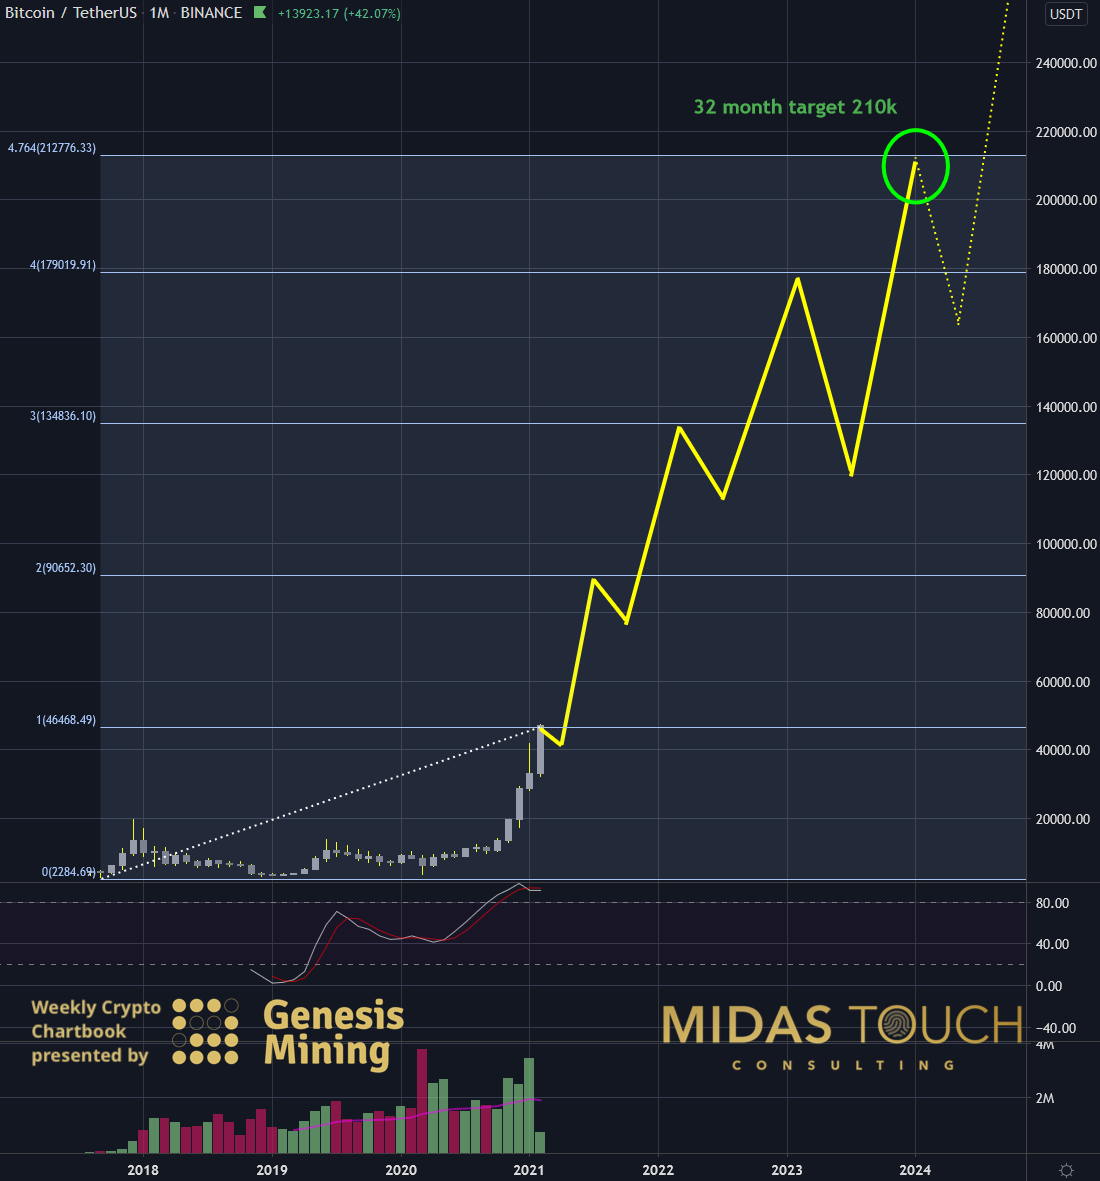
BTC-USDT, monthly chart as of February 9th, 2021
This chart shows what we mentioned as a comment in our last paragraph. Waking up one day and looking back and thinking to oneself: “Why didn’t I buy Google, Amazon, Bitcoin @ $ …, now it is at $…”.
There is no need to bet the farm, but just because Bitcoin is trading near US$47,000 doesn’t mean it is expensive. What is costly is shying away from participation just because entering the market here is the most difficult from a psychological perspective.
Our 32-month projection price, based on a 4.76 Fibonacci expansion, is pointing towards US$210,000!
Bitcoin, the real move is still ahead:
A good example is Warren Buffett’s Berkshire Hathaway stock trading at US$350,000. Indeed, many have underestimated the immense growth of this stock over the last decade. Think about these price levels for Bitcoin within the next few years … and beyond!
Disclaimer: All published information represents the opinion and analysis of Mr Florian Grummes & his partners, based on data available to him, at the time of writing. Mr. Grummes’s ...
more

