
Crypto Chartbook – Expectations In Check
If you compare the average performance of all major hedge funds from 1994 to 2018 you will find them underperforming the S&P by more than 2 percent. These funds cut volatility risk compared to the index by about half. However, you still can get hit hard on your money annually. This depends in what direction the market trades and what your hedge fund of choice is trading in. In other words you can loose all your money. You also have the choice of “pooled funds” or “fund of funds”. Those are investments where you place your money distributed to a group of hedge funds. With management fees of around 1 percent for the hedge fund and the same for the “fund of funds” plus an additional up to 20 percent performance fee in in the hedge fund and up to 10 percent for the “fund of funds” you can end up with a 32 percent fee structure! Making money this way does not look very likely. Yet this is supposed to be the low risk conservative route! Expectations in check.
In our case, we are trading a volatile market, the crypto space. This does not mean individual trade performance has to be staggering just because there is a lot of hype within such a market niche. Don’t follow greed just because in the crypto space other participants expect you doubling your investment or even more in a single trade. It is consistency that you should be after.
Bitcoin Daily Chart, Time To Enter:
(Click on image to enlarge)
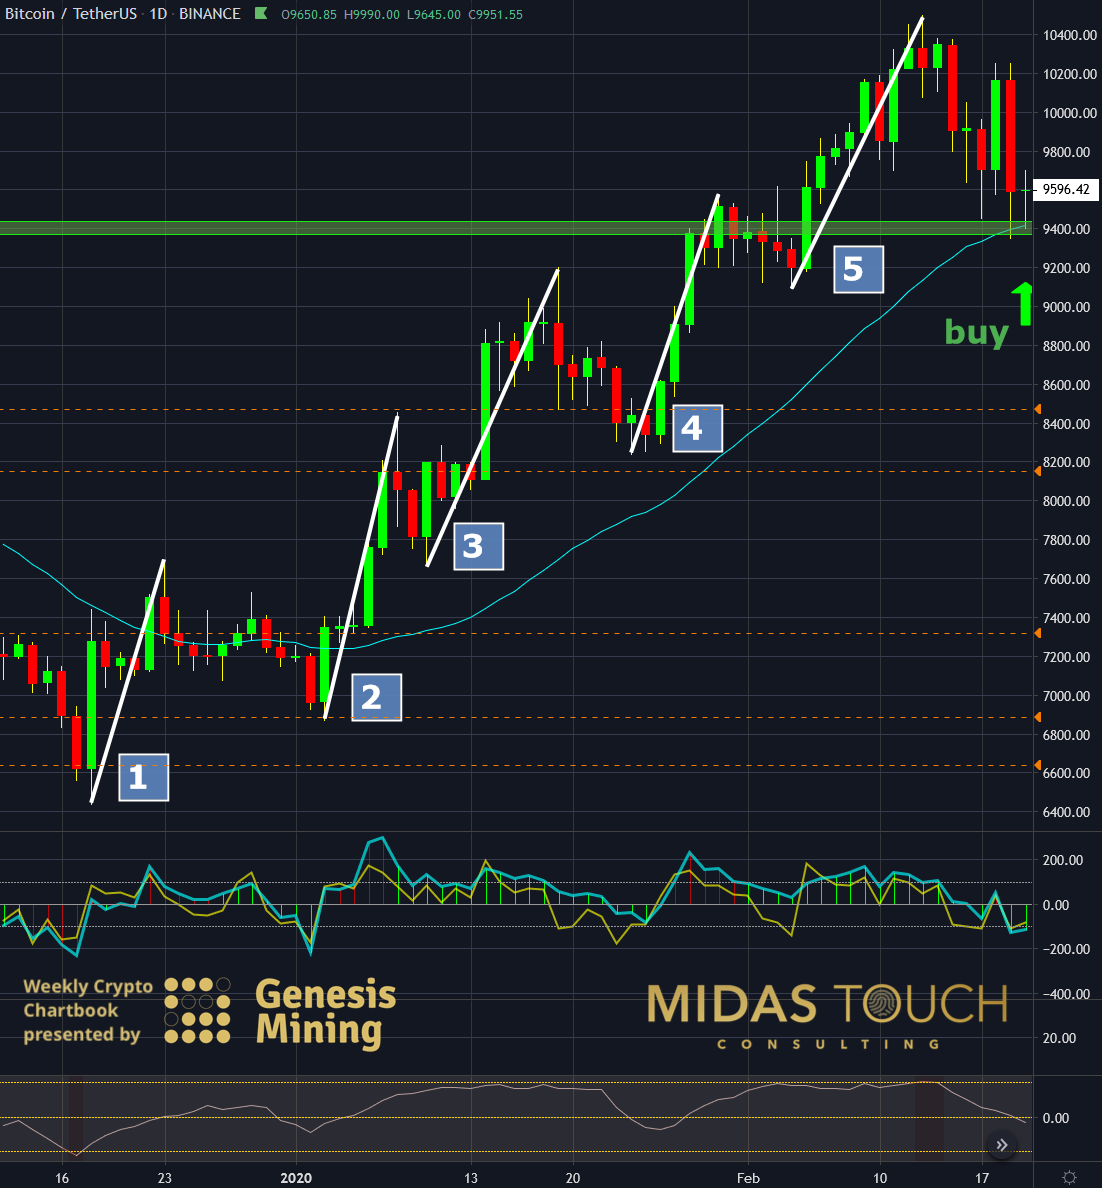
BTCUSDT daily chart as of February 20th, 2020
On the 20th of February, we opened a position in Bitcoin (BTC) with a reload to our established holdings. Dotted orange horizontal lines represent prior entry price levels where we still have partial position sizes exposed to the market. These are the so-called “runners” (find more in our online glossary).
We established the entry zone (green horizontal band) to be of supply and demand support. This edge was based on fractals, VWAP (Volume weighted average price indicator) and the fibonacci retracement from a horizontal support perspective. That was in line with our directional support zones of simple moving average support around US$9,400.
It was an aggressive reload zone since the market had already progressed to its 5th leg up (white lines). Directional markets (=trending) and extremely low-risk entry zones are defined in our system approach to be more aggressively participated in.
Beside bitcoin we took positions in DASH, ETH, XMR, ZEC and LTC. All entries were posted in real-time in our Telegram channel.
Litecoin Daily Chart, Low Risk Entry And Immediate Profits:
(Click on image to enlarge)
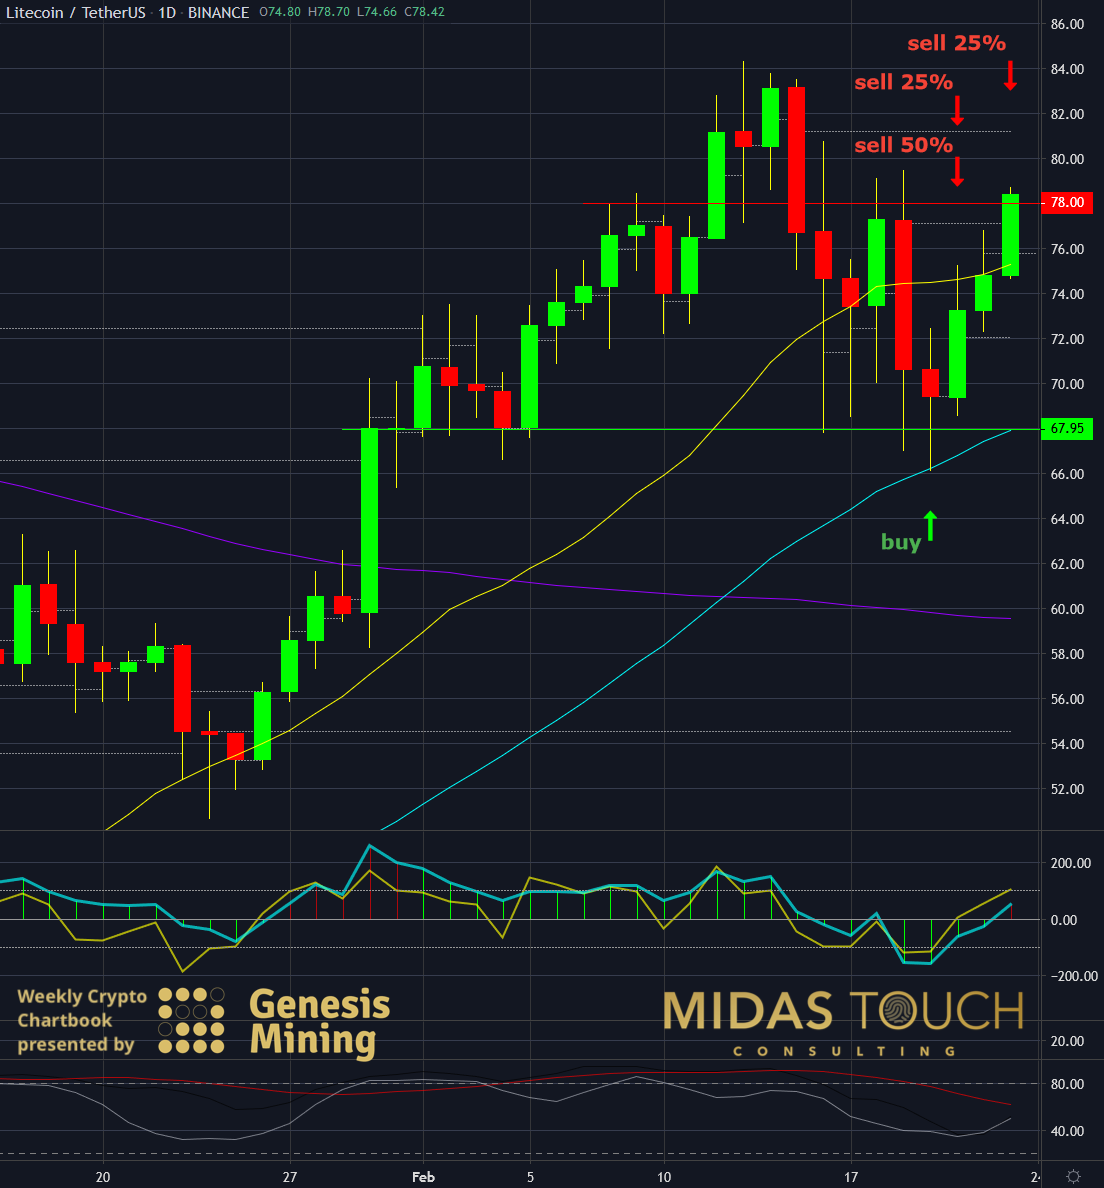
LTCUSDT daily chart as of February 22nd, 2020
The daily Litecoin (LTC) chart above shows our entry and exit points. We aggressively took partial profits quickly to reduce risk to zero and play with the markets money instead. You can learn more about our approach with our quad exit strategy. When counter signals were on the horizon we fully exited the position. Our three target exits were profiting 4.26%, 6.40% and 11.74%. All this within three days.
Bitcoin Daily Chart, Runner Stopped Out, Expectations In Check:
(Click on image to enlarge)
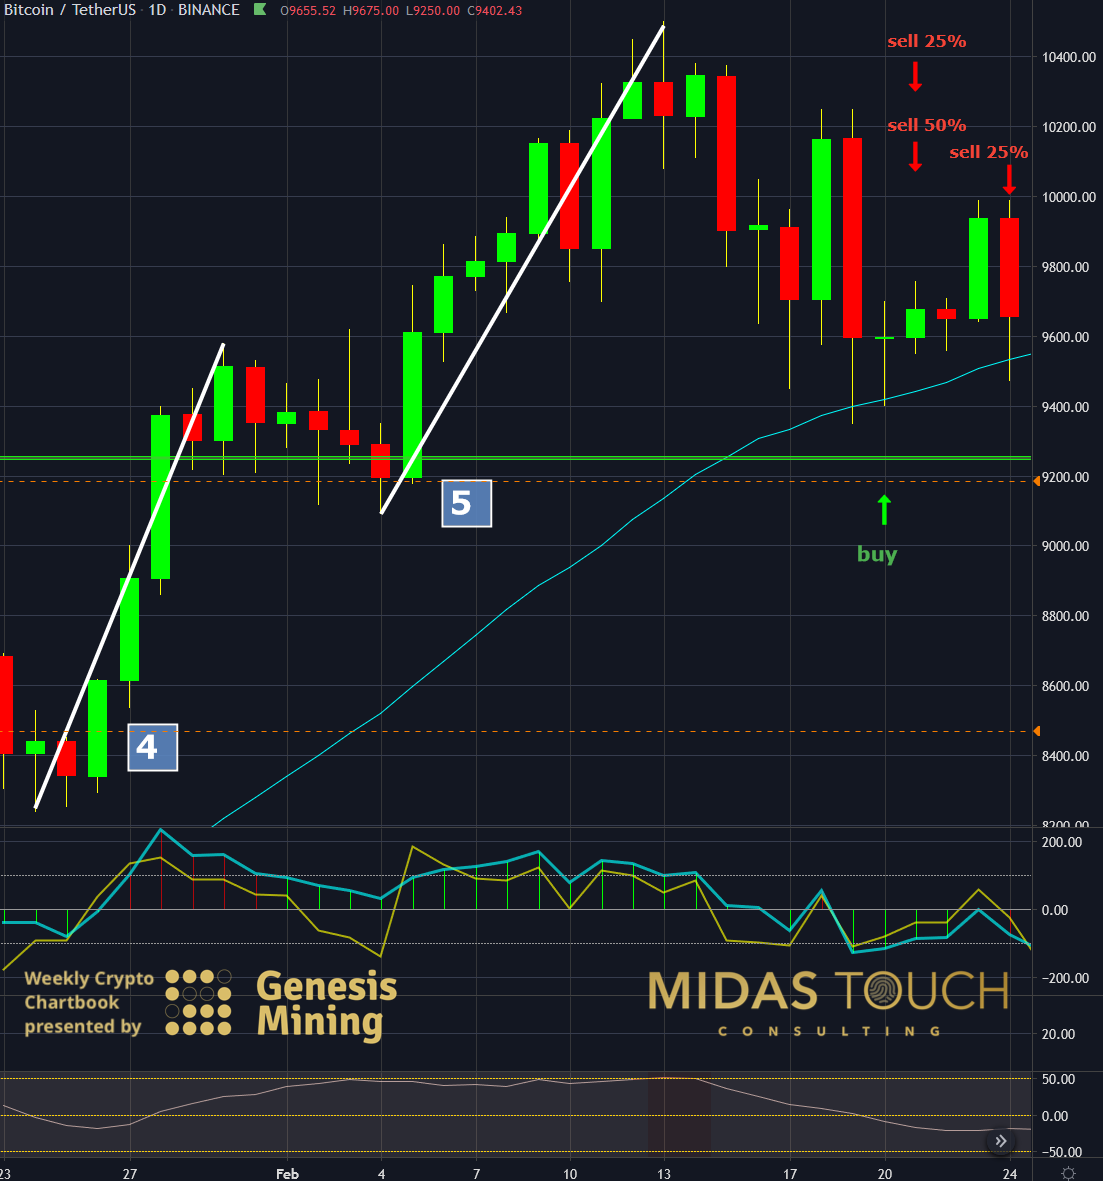
BTCUSDT daily chart as of February 24th, 2020
While we exited the LTC position entirely, we kept a runner on the BTC position. It provides for the option that a small portion runs further just like the runners from the orange dotted line entry levels. Doing this in a trend environment over and over and over again might seem like a boring endeavor, but… disciplined trading like this on a consistent basis results in a smooth equity curve.
This time though, the runner got stopped out at the break-even entry level on the 24th of February.
Bitcoin Daily Chart, Another opportunity:
(Click on image to enlarge)
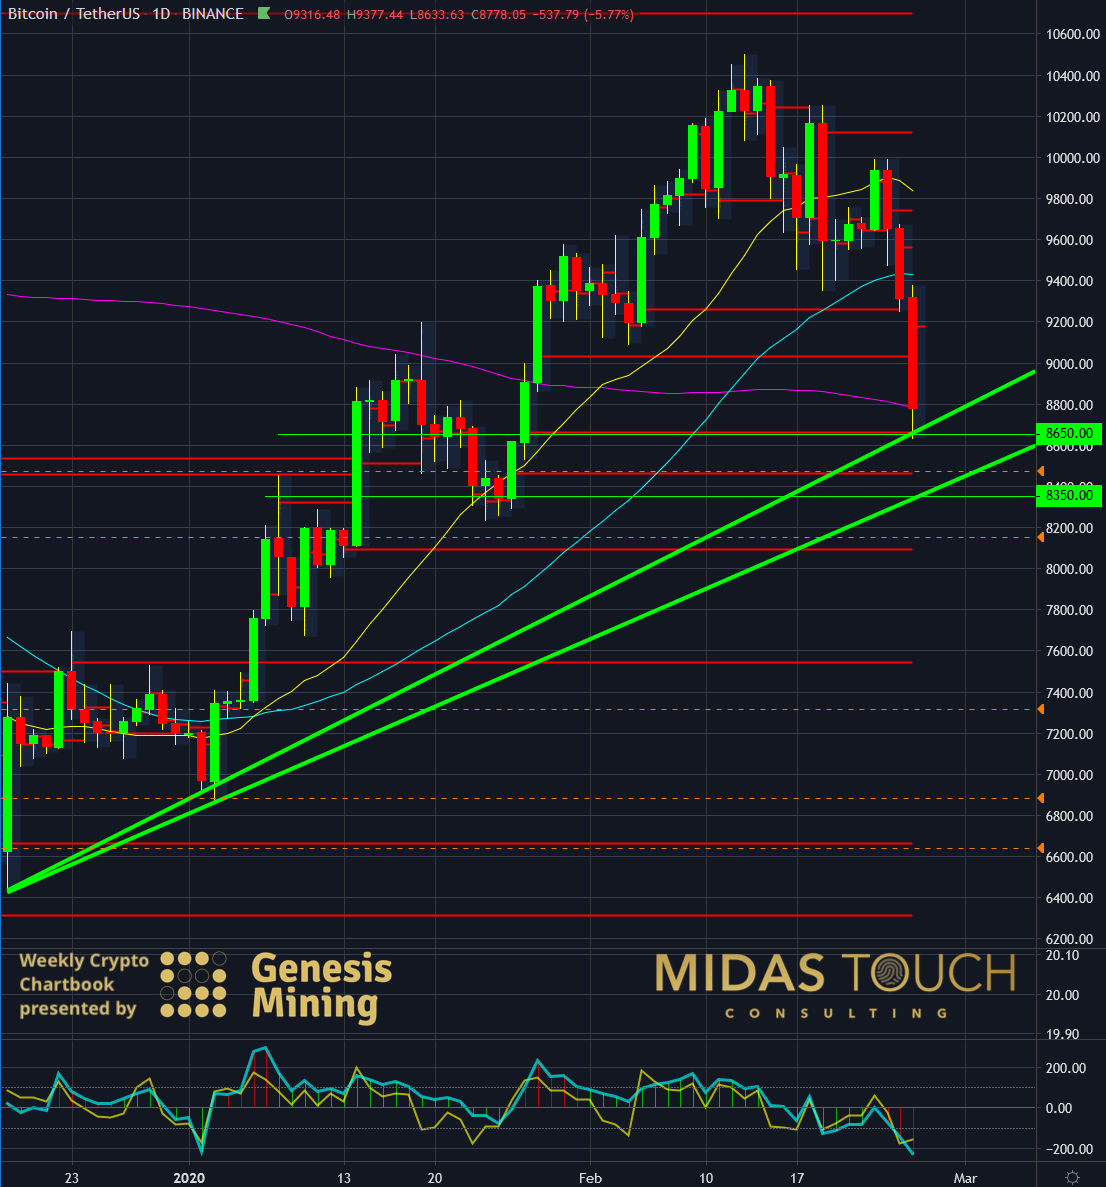
BTCUSDT daily chart as of February 26th, 2020
With the completion of a 5th leg up, it was smart to cash in Litecoin completely. Shortly after the Bitcoin market depreciated nearly 18 percent from its recent highs. This again provides possible opportunity. We look to participate in the markets again, should we see signs of a bottom building near the price regions of US$8,650 or US$8,350.
Expectations in check
Market participants are in this game for many reason not just for our basic human need for security (= making money). This need goes alongside with the need for variety just as well (= i.e. gambling). More fortunes have been lost than made and if pulling the trigger gives you any kind of rush or satisfaction on an emotional basis, more likely than not, you’re in this game for the wrong reasons. One shouldn’t follow suit of what crowd behavior suggests and the average expectations might be. Positioning yourself outside the norm with your expectations and setting them to a prosper outcome instead, has a much higher likelihood to provide the desired trading outcome. Consistent returns!
Disclosure: None.


