
Crude, Credit, & Yield Curve Collapse As Stock Shorts Soar To 4-Year Highs
"Growth Scare" - PMIs in Japan, Europe, and the US all collapsed and risk-asset markets are suddenly waking from their delusions.
Well that escalated quickly...
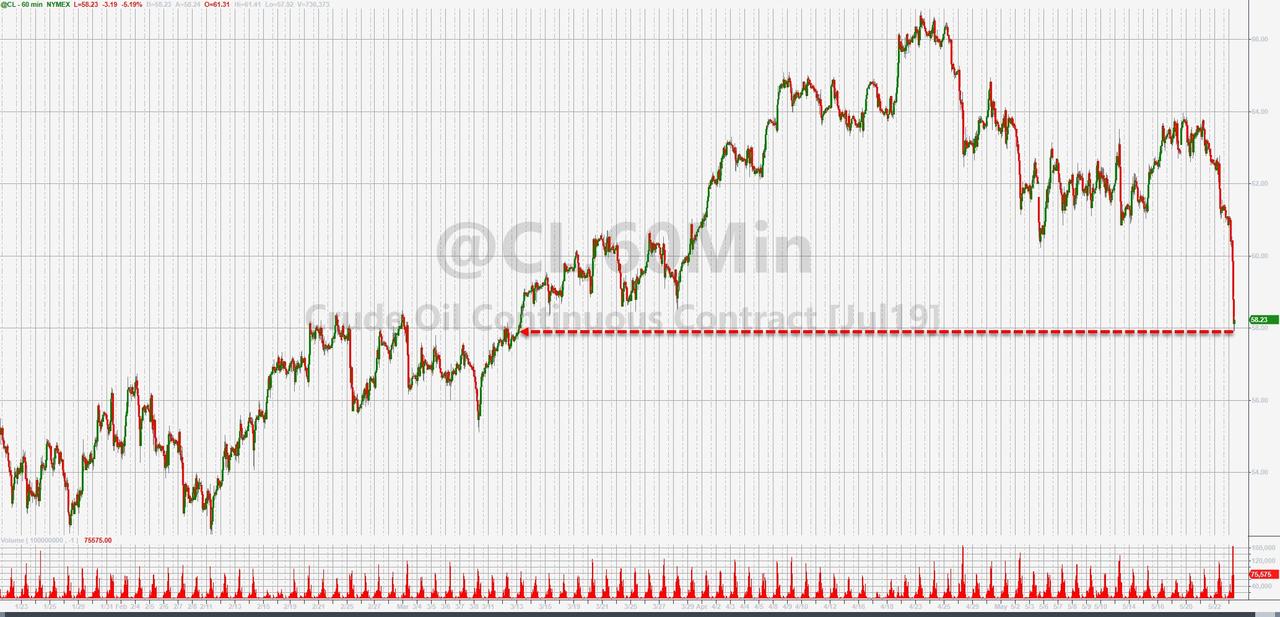
WTI Crude crashed to a $57 handle (its worst day of 2019)...
(Click on image to enlarge)
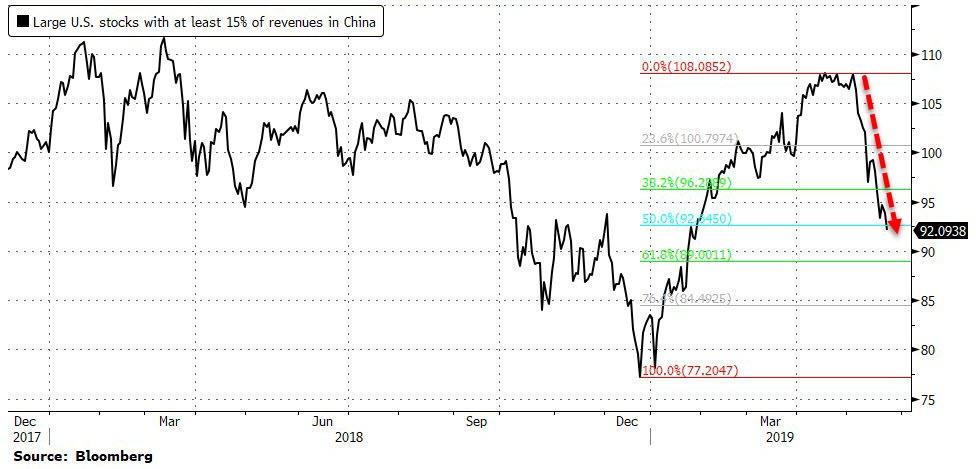
US equities suffered after Huawei headlines signaled US-China trade tensions are escalating fast (and a base-case 'deal' is disappearing). "Trade War"-related stocks have given up over half their post-December-collapse gains...
(Click on image to enlarge)
And as, Bloomberg's Sarah Ponczek notes, investors haven’t been this keen to short the U.S. stock market since the Federal Reserve started raising interest rates.
(Click on image to enlarge)
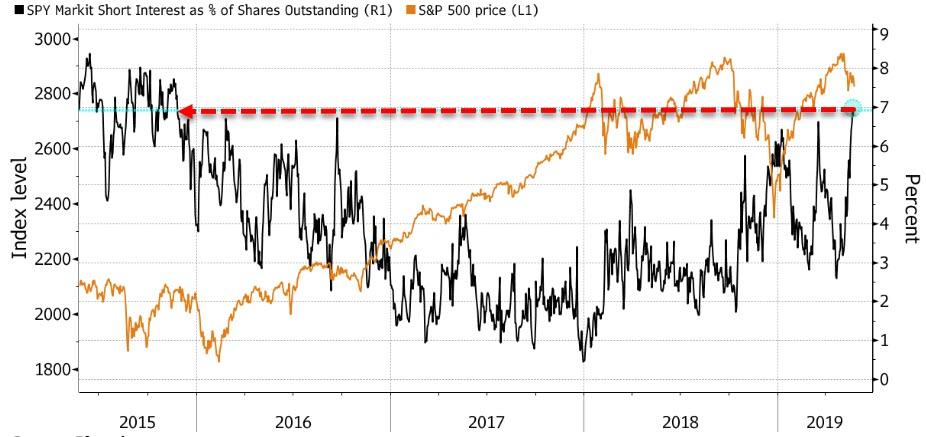
Short interest as a percentage of shares outstanding on the SPDR S&P 500 ETF Trust, or SPY, climbed as high as 7% this week, according to data from IHS Markit Ltd. That’s the highest share since 2015, when the benchmark gauge for American equities slipped into a correction as Fed officials began boosting rates from near zero.
“There are some clouds forming on the horizon,” said Matthew Litfin, a money manager at Columbia Threadneedle Investments. Besides the U.S.-China dispute, “you also can’t really have this Goldilocks thing that we’re in, where the economy is pretty good and the Fed’s seen to be easing. The Fed doesn’t feed the fire, the Fed takes away the punch bowl. They don’t refill the punch bowl at the party,” he added.
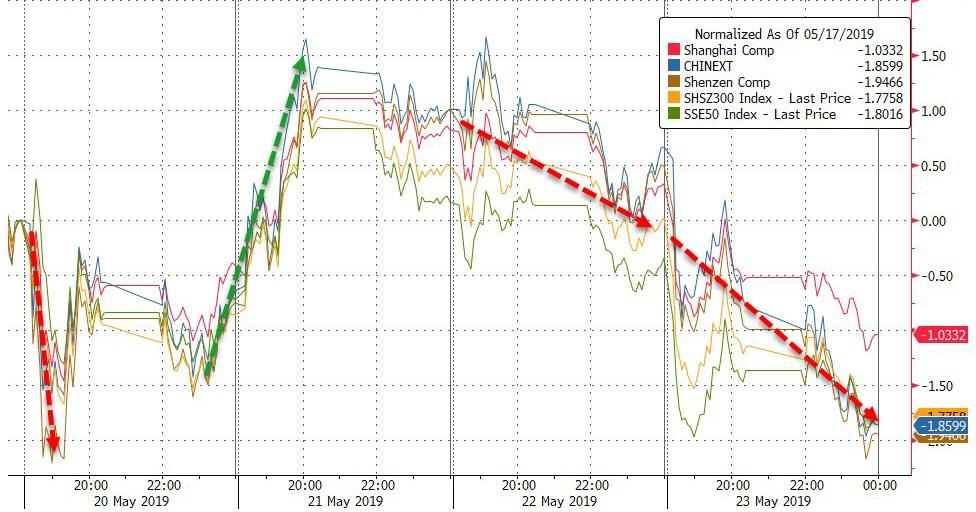
China was ugly overnight as Huawei headlines hit...
(Click on image to enlarge)
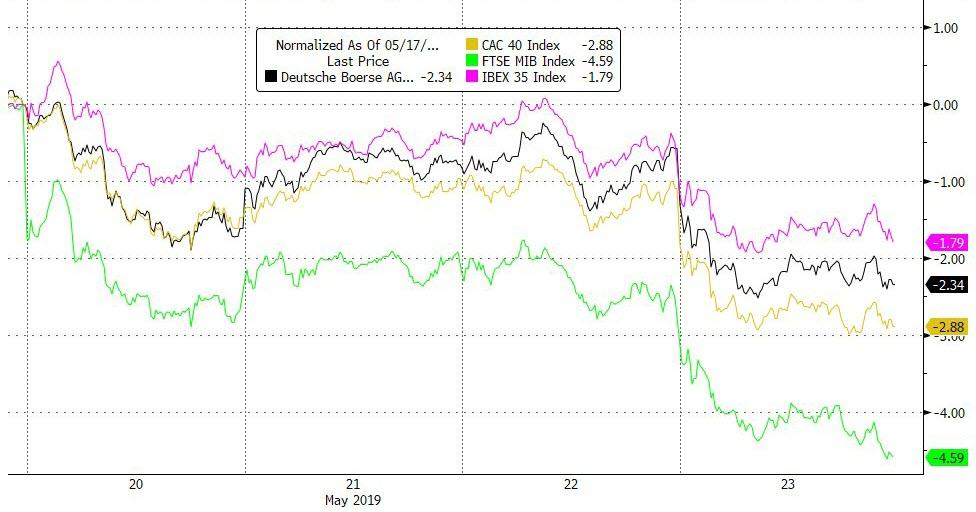
Europe was ugly, not helped by dismal confidence and PMIs in Germany...
(Click on image to enlarge)
And US equities were a bloodbath with tech wrecking once again...Trannies are the worst on the week, and The Dow is outperforming (though all are red on the week)...
(Click on image to enlarge)
Of course, it wouldn't be 'Murican free markets without a panic-rescue-bid (on no headlines whatsoever) into the close...
(Click on image to enlarge)
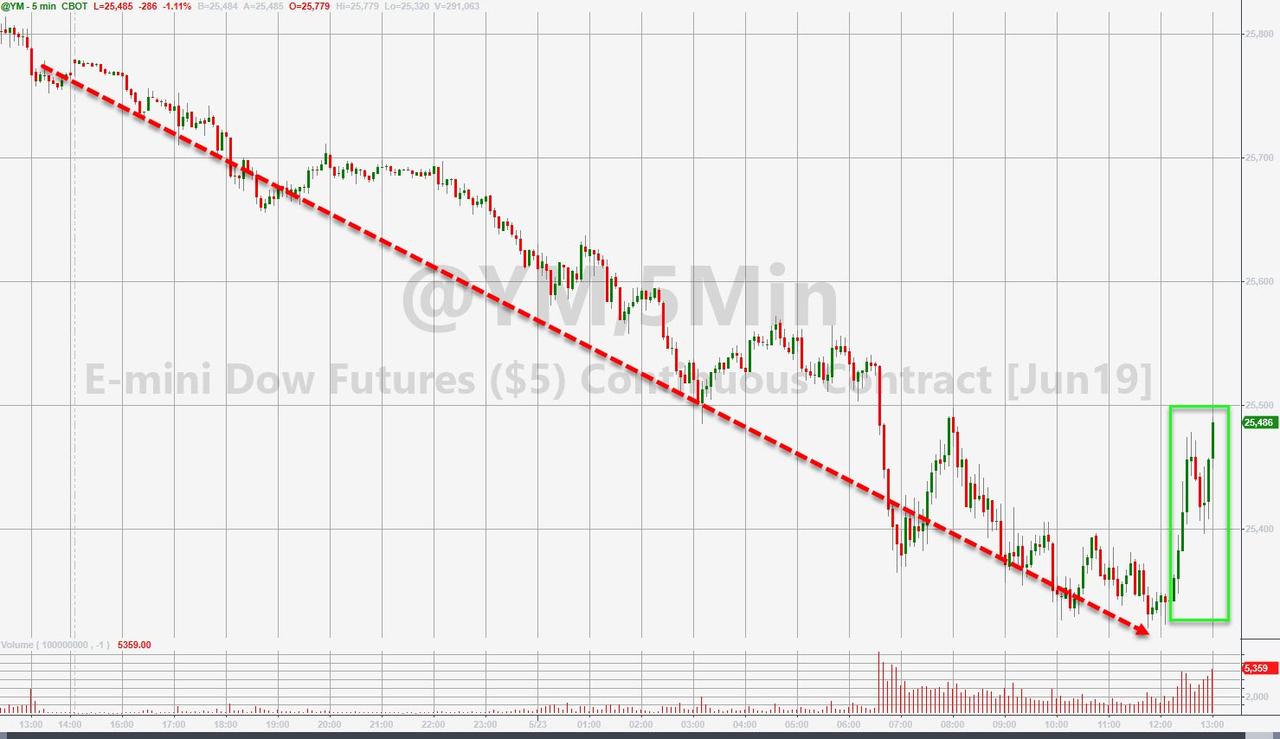
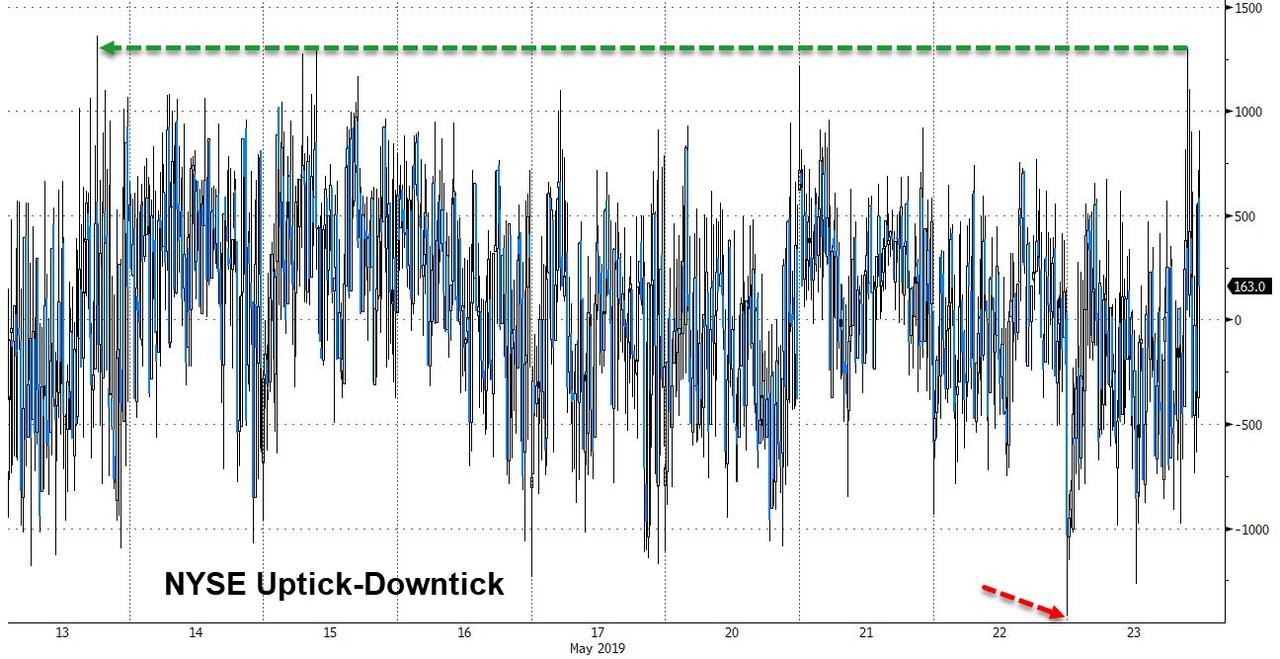
This was the biggest buy program in over a week at 3:20 pm ET (after the biggest sell at the open since January)...
(Click on image to enlarge)
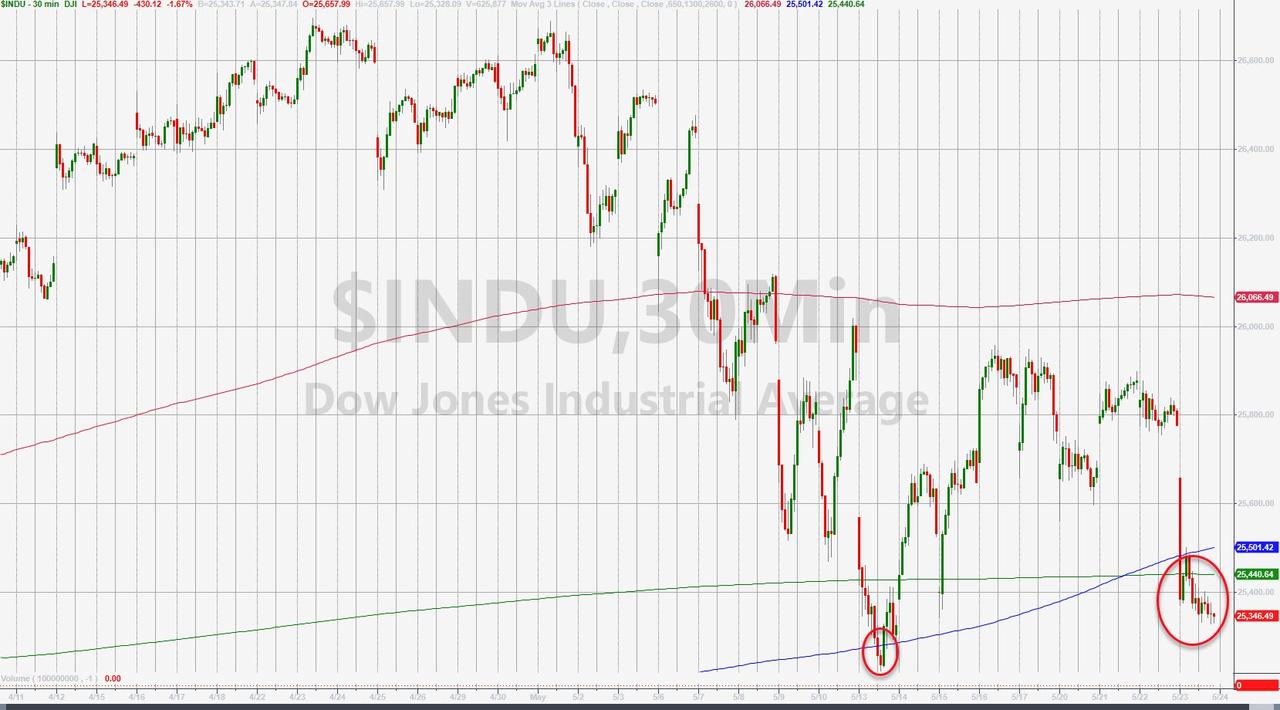
The Dow closed below its 200DMA for the first time since January...
(Click on image to enlarge)
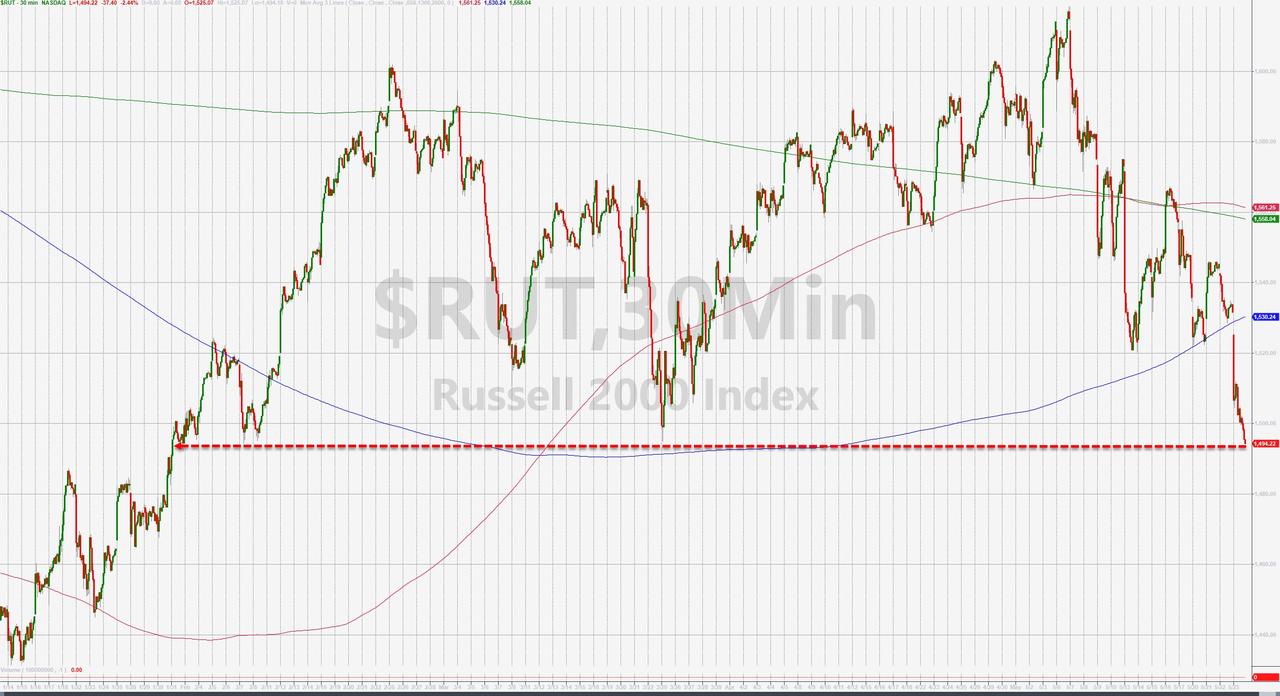
Small Caps plunged to their lowest since January...
(Click on image to enlarge)
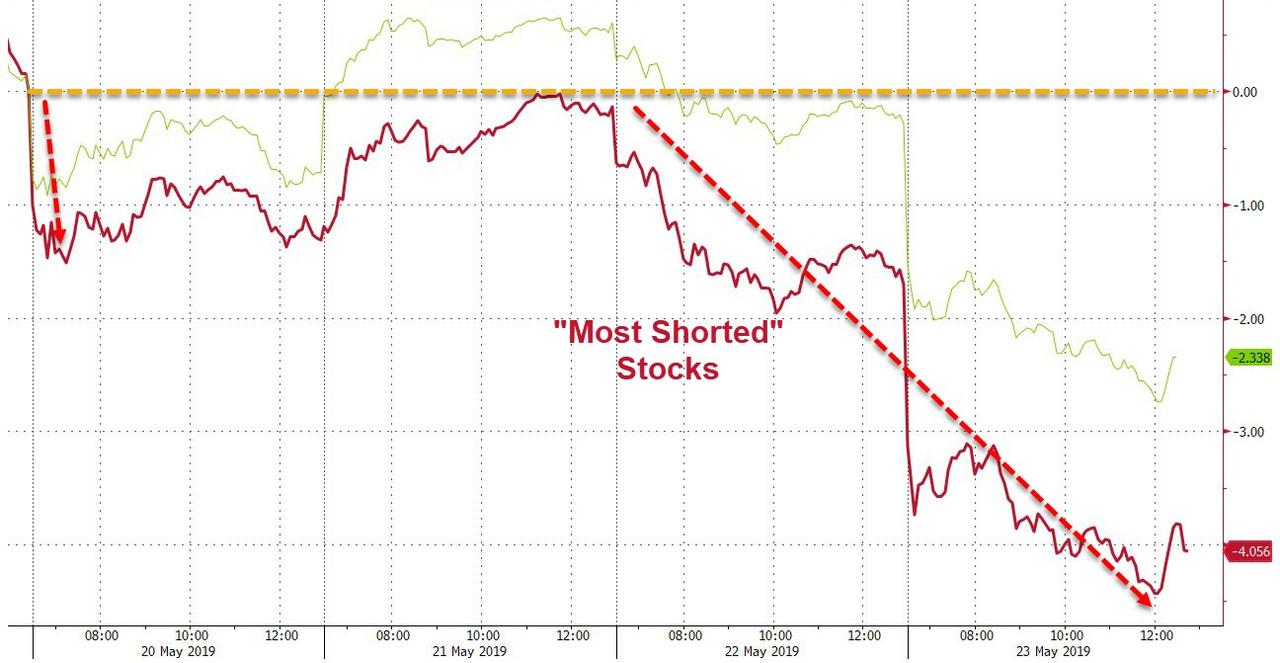
This is the biggest two-day drop in "Most Shorted" stocks since the Dec 24th lows...
(Click on image to enlarge)
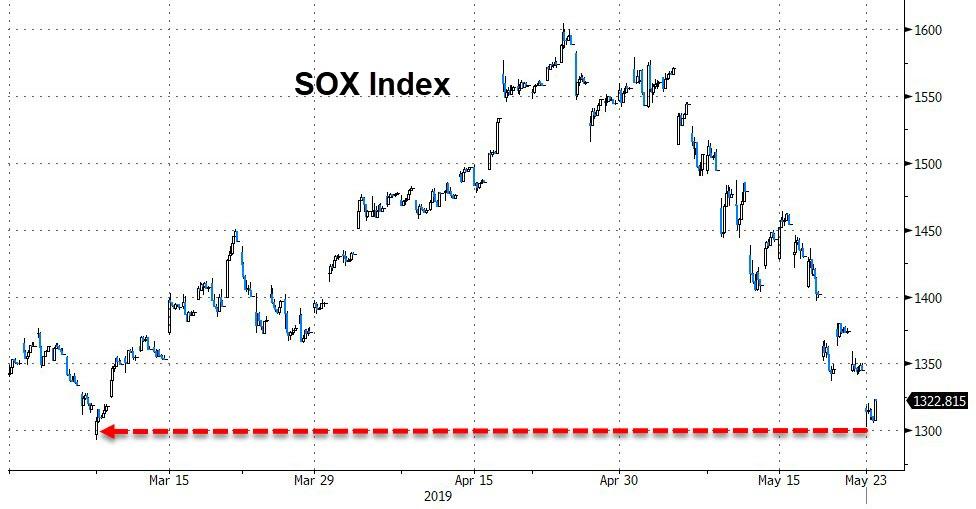
Semis were down once again (down almost 19% from highs)
(Click on image to enlarge)
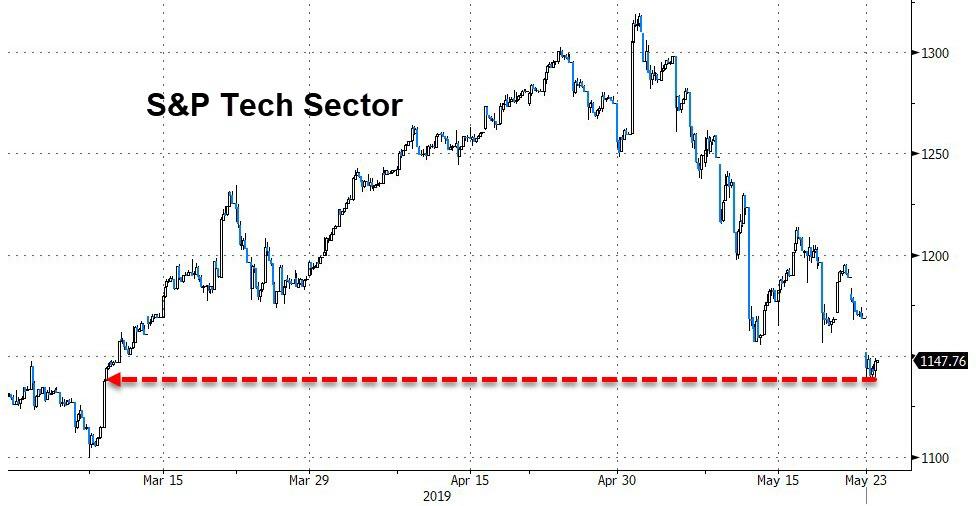
And overall tech stocks wrecked...
(Click on image to enlarge)
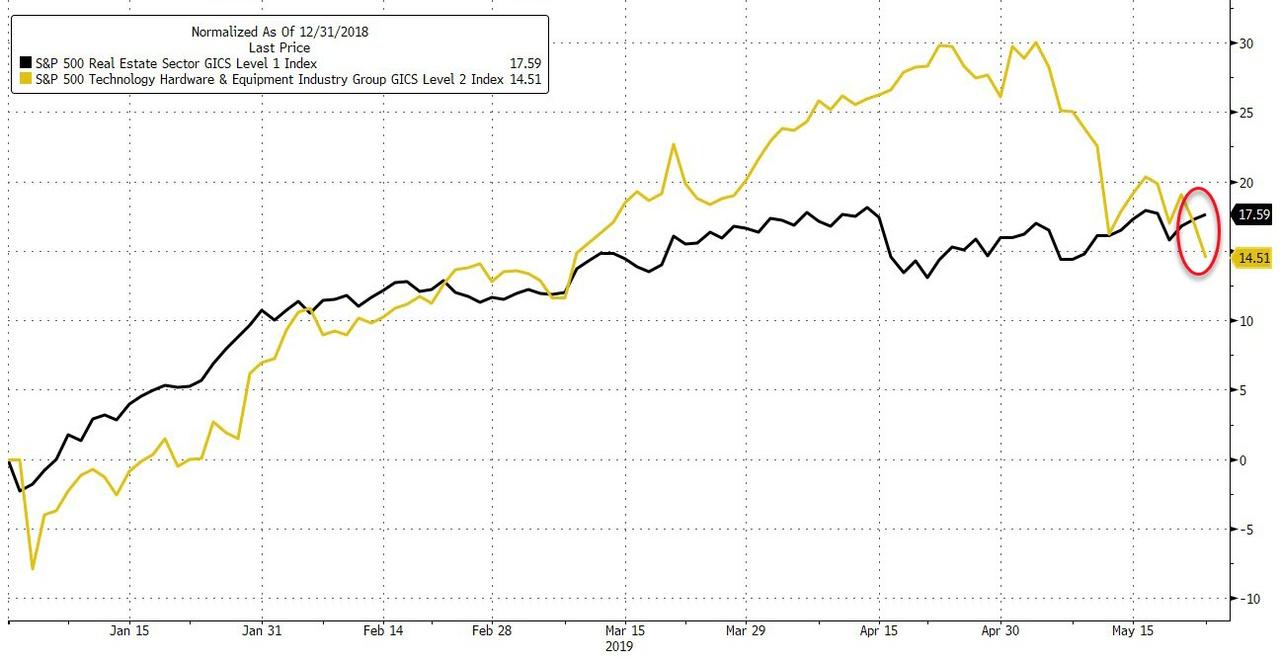
Real Estate overtook Tech as the best performing sector...
(Click on image to enlarge)
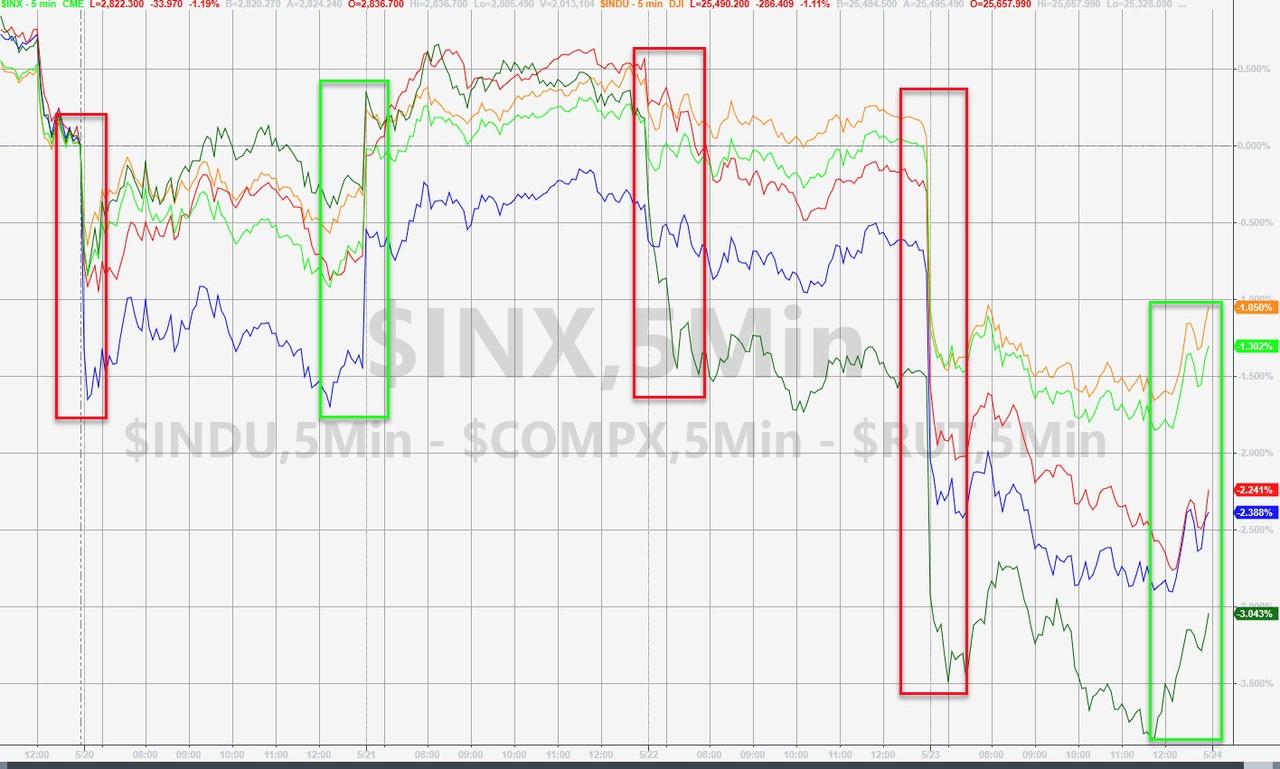
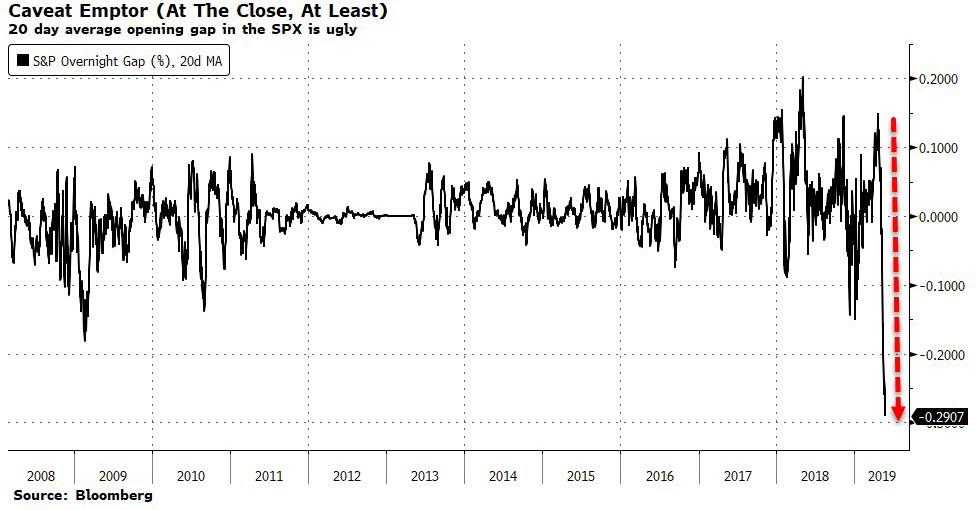
Before we leave equity land, this stunning chart from Bloomberg strategist Cameron Crise exposes the odd regime shift of the last few weeks... Day after day, we see overnight selling pressure, only to be bid back at the cash open. One could be forgiven for thinking the trade war is being played out between The Plunge Protection Team and The National Team battling to show how trade tensions are not affecting their stock markets. Think we're crazy?
The US stock markets are sliding as investors fear over China-US trade war. The real situation could be even worse. The only room left for manoeuvre is the leaders of the two countries still maintain personal respect for each other.
— Hu Xijin 胡锡进 (@HuXijin_GT) May 23, 2019
But, as Crise notes, these huge opening down gaps are pretty clearly a sign of trouble, and we're now at the point that we've exceeded anything observed during the crisis...
(Click on image to enlarge)
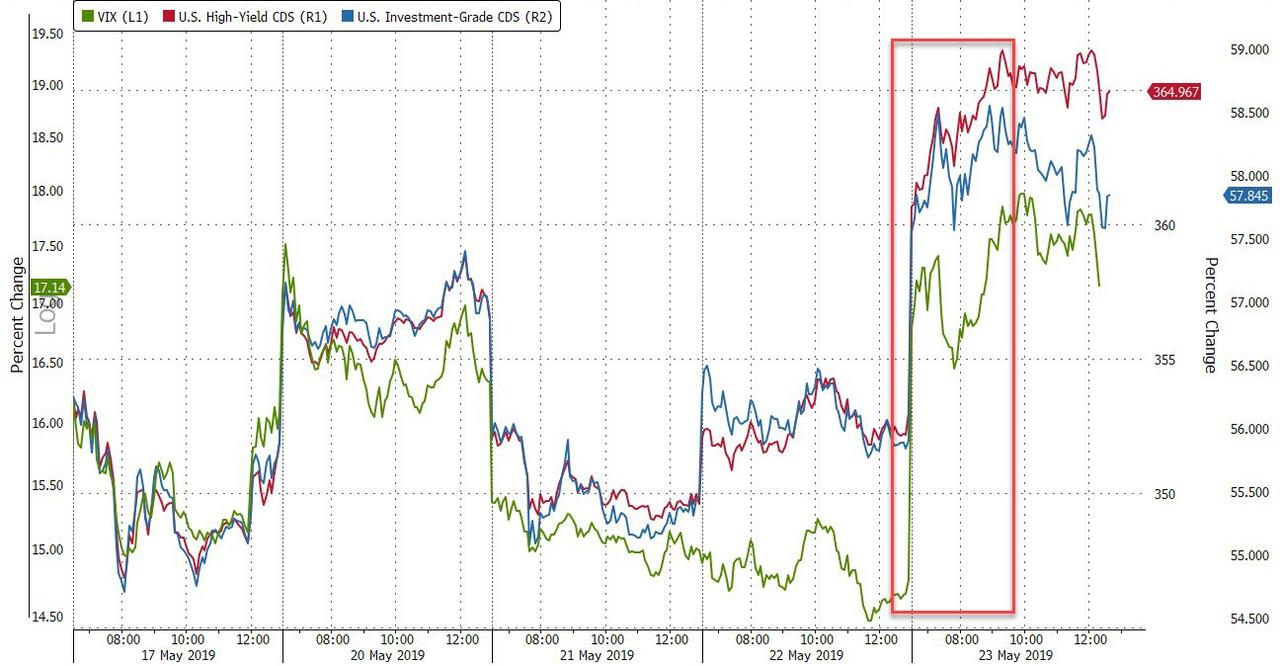
Credit and equity protection costs spiked today (with HY most notably weaker)...
(Click on image to enlarge)
Treasury yields tumbled on the day...
(Click on image to enlarge)
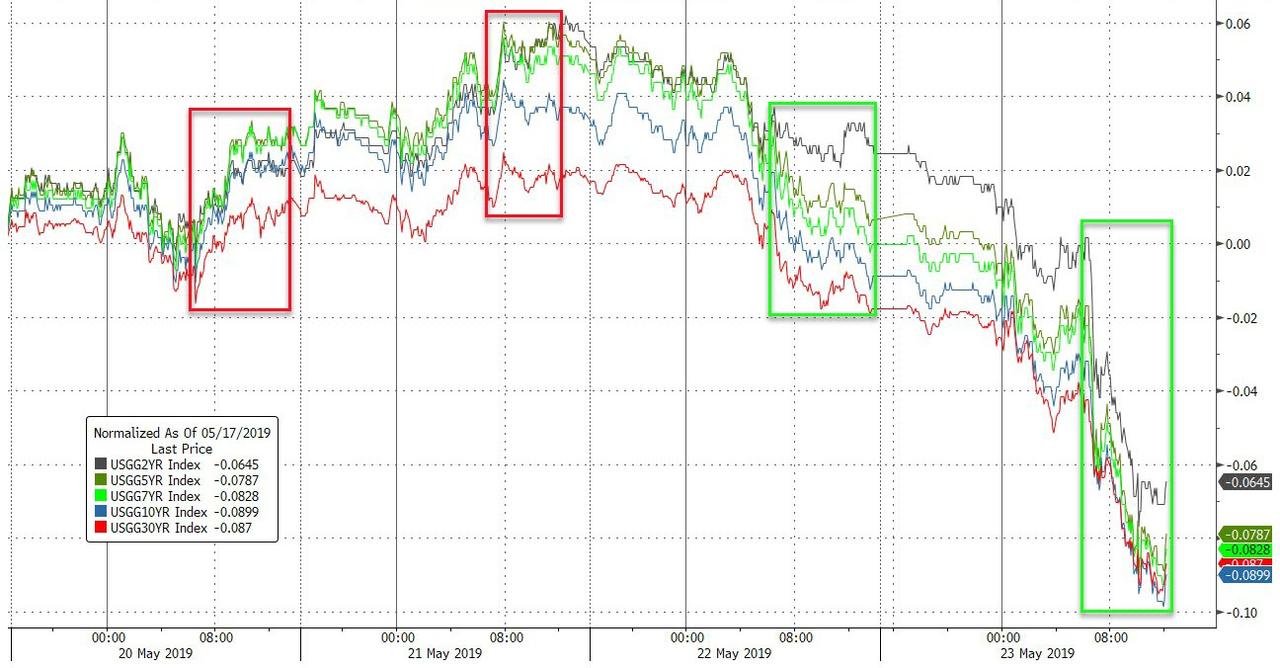
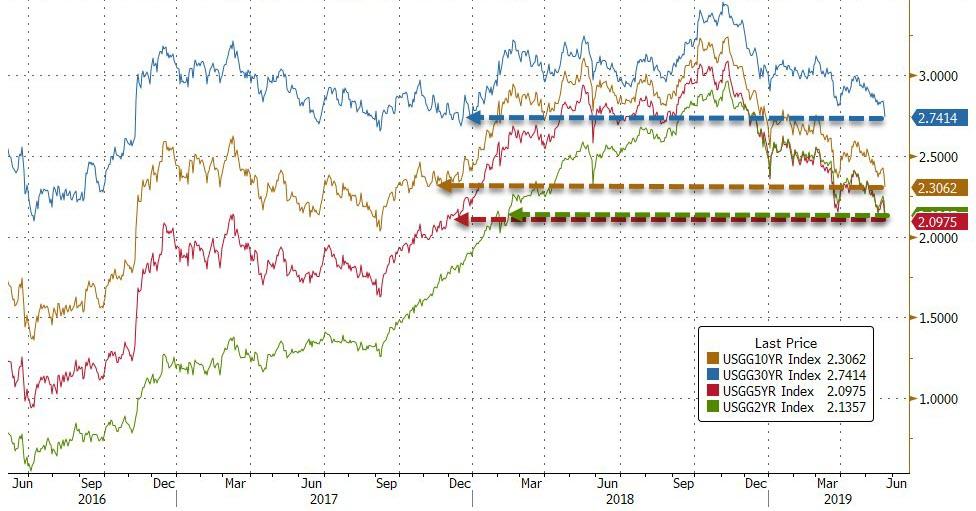
Across the curve this was new cycle lows for yields (5Y and 30Y lowest since Dec 2017, 10Y lowest since Nov 2017, 2Y lowest since Feb 2018)...
(Click on image to enlarge)
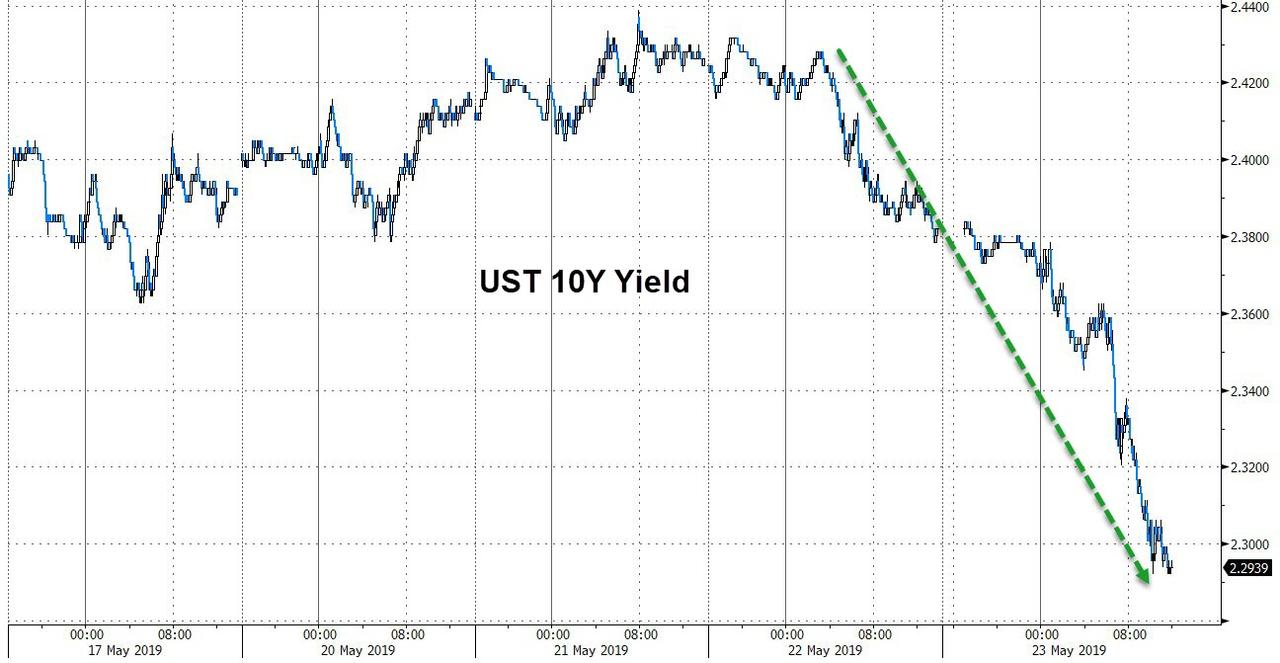
The 10Y Yield plunged below 2.30%!!
(Click on image to enlarge)
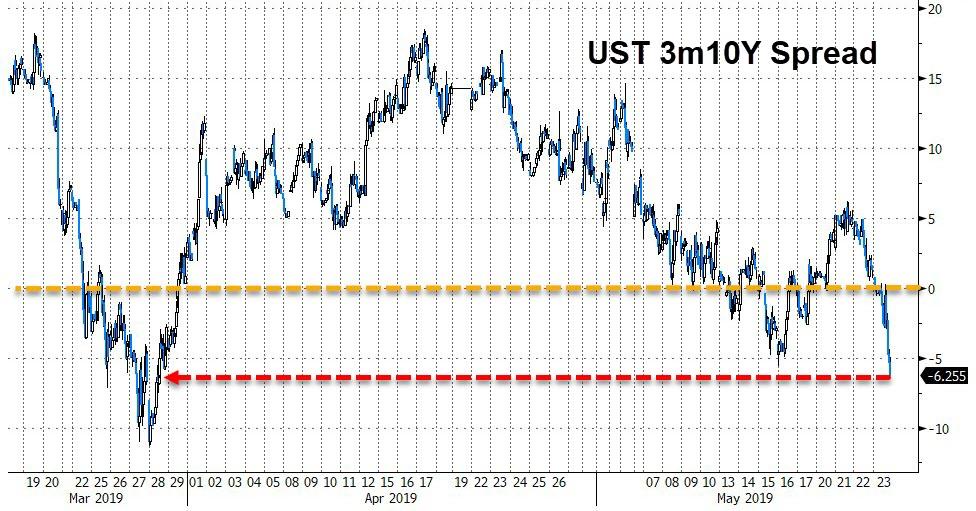
The yield curve crashed back into inversion...
(Click on image to enlarge)
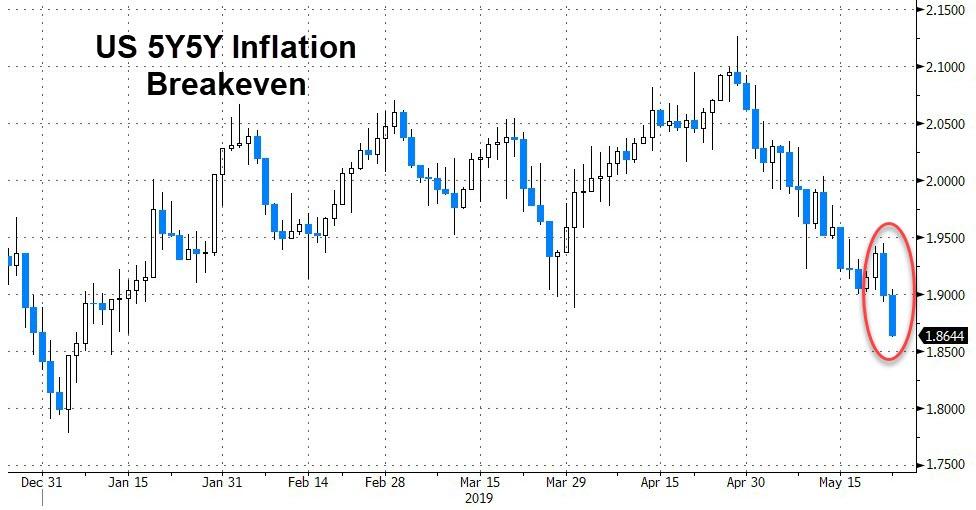
Markets have seen the biggest two-day drop in 5-10 year inflation expectations since mid-2017, based on futures contracts...
(Click on image to enlarge)
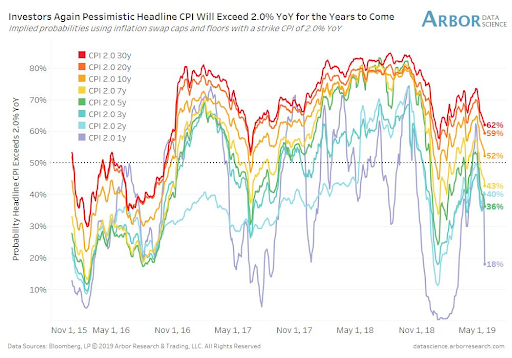
And inflation swap caps/floors say 'no way' to headline CPI > 2.0% YoY for next 2-7 years...
(Click on image to enlarge)
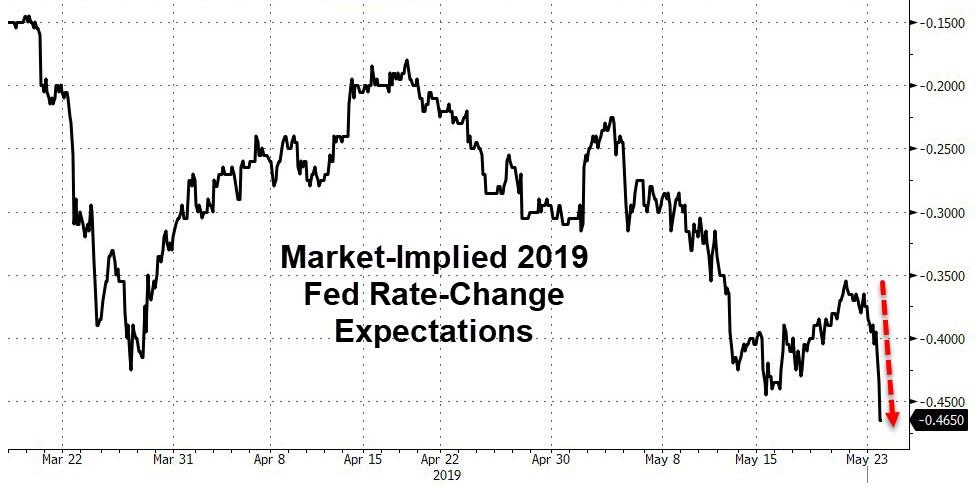
Finally, before we leave rates-land, market expectations for 2019 Fed rate actions have collapsed to a stunning 46bps rate-cut expectation...
(Click on image to enlarge)
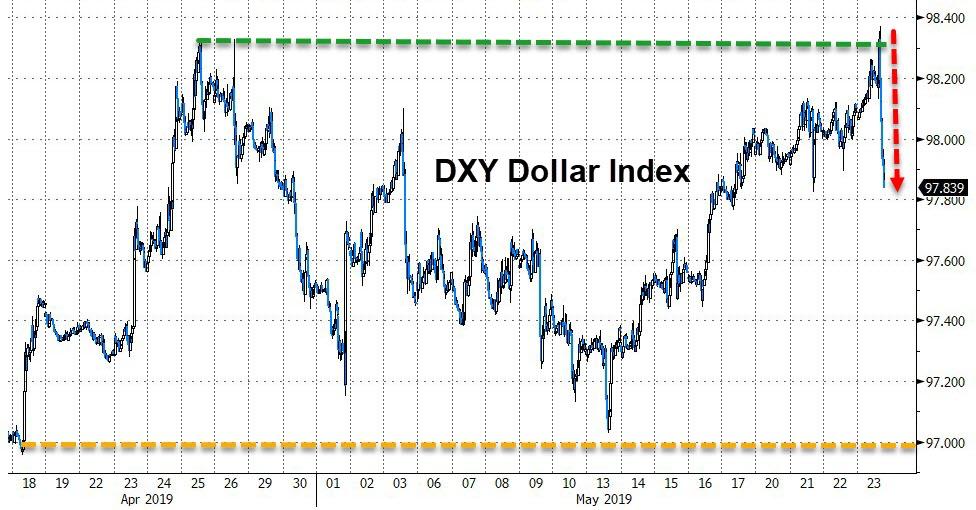
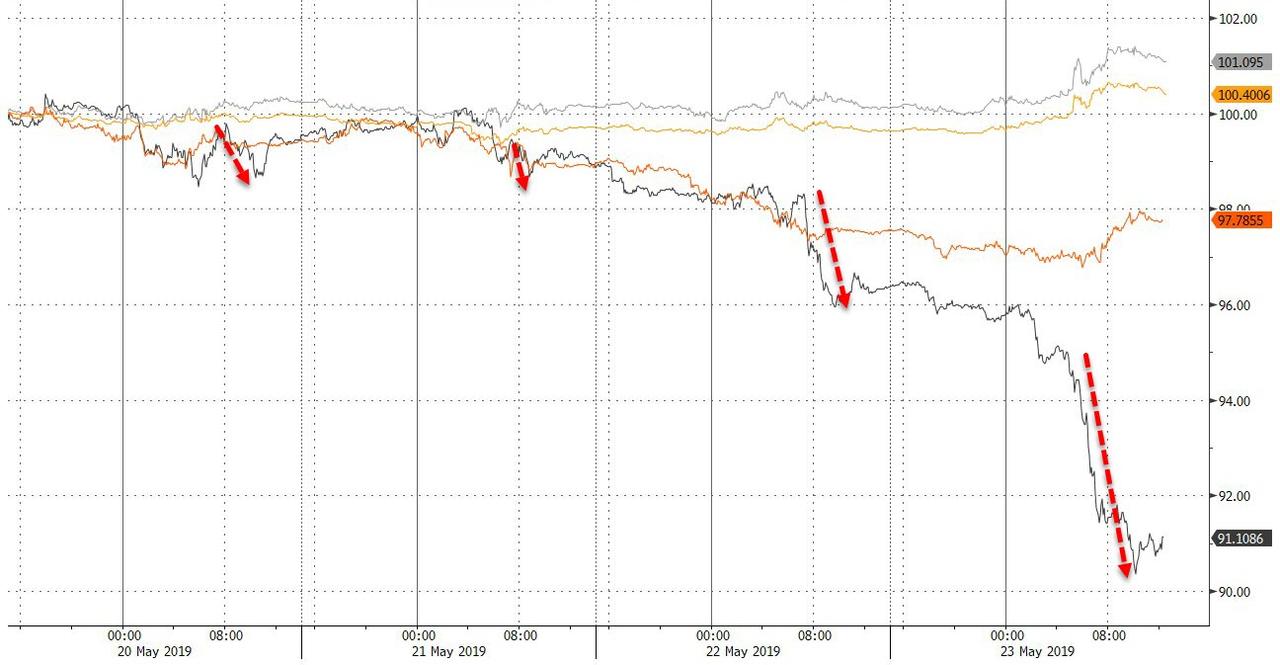
The DXY Dollar Index shot up overnight to fresh 24-month highs, and then plunged...
(Click on image to enlarge)
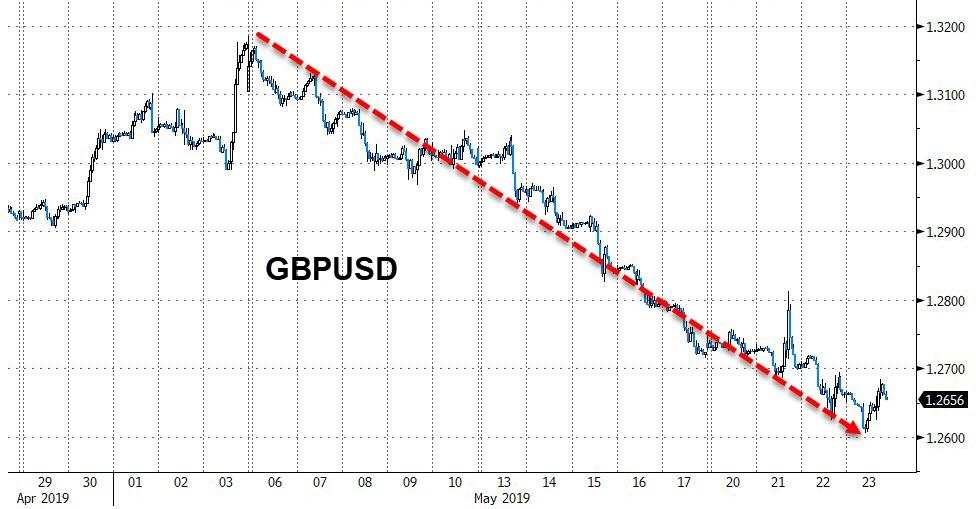
Cable ended very marginally lower (after bouncing hard off 1.26 the figure)...
(Click on image to enlarge)
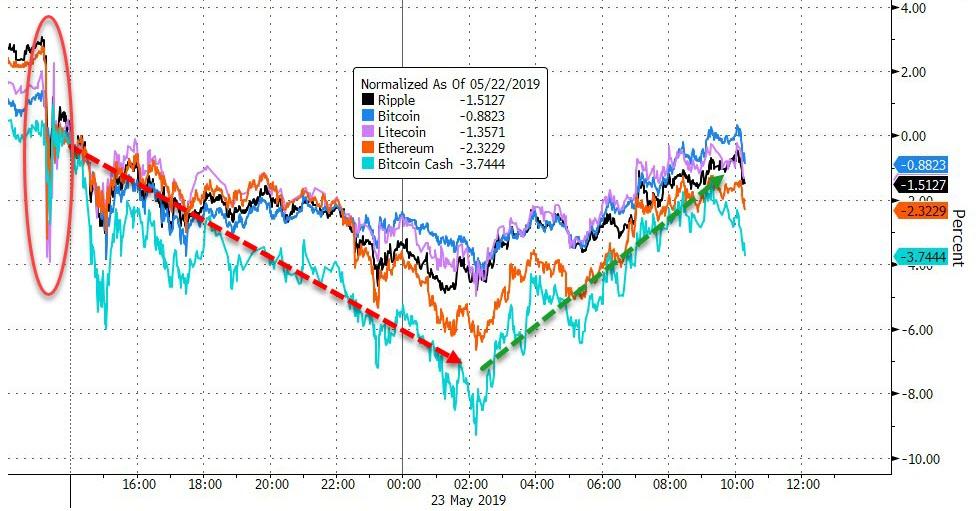
Cryptos were down modestly on the day, after plunging overnight and recovering once US market liquidity arrived...
(Click on image to enlarge)
Silver continues to lead the week, with crude collapsing...
(Click on image to enlarge)
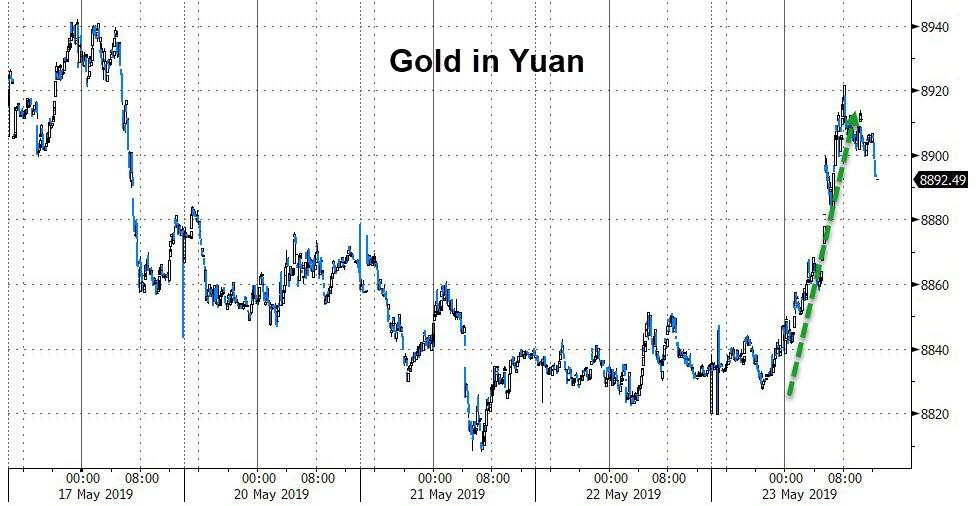
Gold jumped against the yuan (and dollar)...
(Click on image to enlarge)
Finally, some food for thought from Gluskin-Sheff's David Rosenberg...
Look at this chart of major appliance shipments – collapsing 17% YoY in April – and tell me we aren’t heading into a recession. pic.twitter.com/dwKzt7u8SX
— David Rosenberg (@EconguyRosie) May 23, 2019
As @MikaelSarwe asked earlier, are we seeing a similar breakdown of various "leading" market-based indicators as last summer, before the equity market crash in Q4?
(Click on image to enlarge)
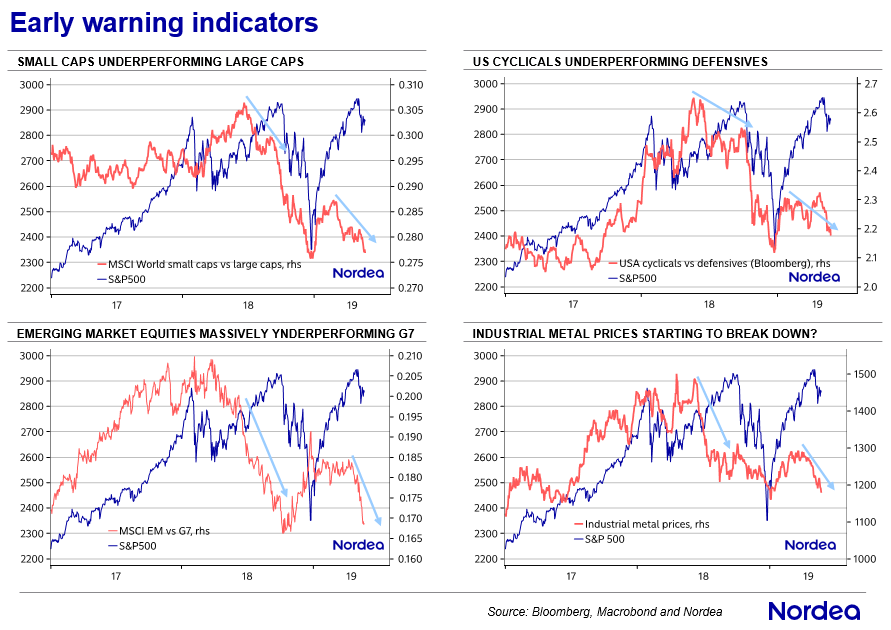
Probably nothing... "transitory"?
Disclosure: Copyright ©2009-2018 ZeroHedge.com/ABC Media, LTD; All Rights Reserved. Zero Hedge is intended for Mature Audiences. Familiarize yourself with our legal and use policies every ...
more

