
CPI Inflation In September
Headline slightly above Bloomberg consensus (0.4% vs. 0.3% m/m) and core at consensus (0.4%), but month-on-month inflation rates are down relative to peaks earlier in the year. Re-opening inflation rates are decreasing in importance, as energy rises. The inflation is becoming more broad-based.
Headline m/m annualized:
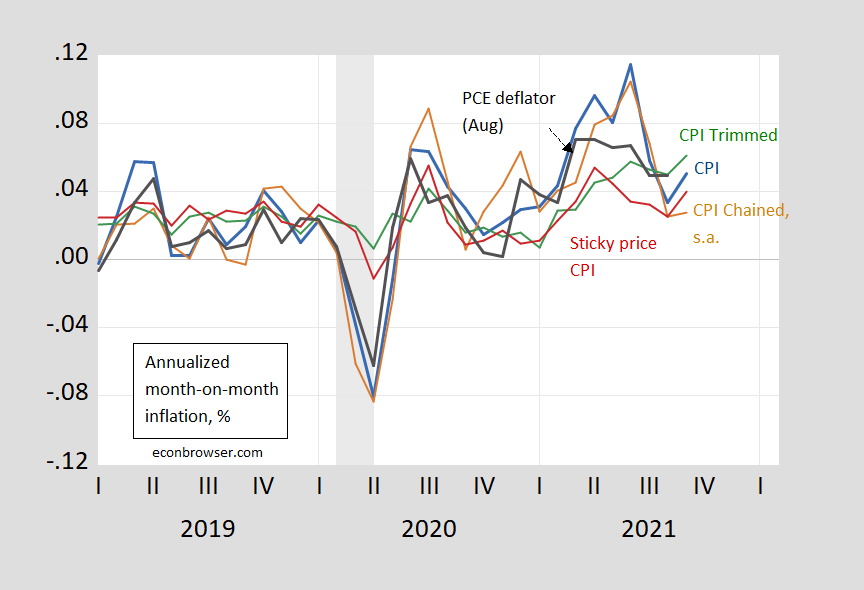
Figure 1: Month-on-month annualized inflation from CPI-all urban (blue), from personal consumption expenditure (PCE) deflator (black), chained CPI seasonally adjusted(brown), sticky price CPI (green), and 16% trimmed mean CPI (red). Chained CPI inflation seasonally adjusted by author. NBER defined recession dates shaded gray. Source: BLS, Atlanta Fed, Cleveland Fed, via FRED, NBER, and author’s calculations.
Note that the trimmed CPI inflation rates blipped upward signaling the inflation pressure was more broad-based than in recent months.
The sticky price inflation rate also rose, indicating that less frequently changed prices are also moving.
Core inflation, also m/m:
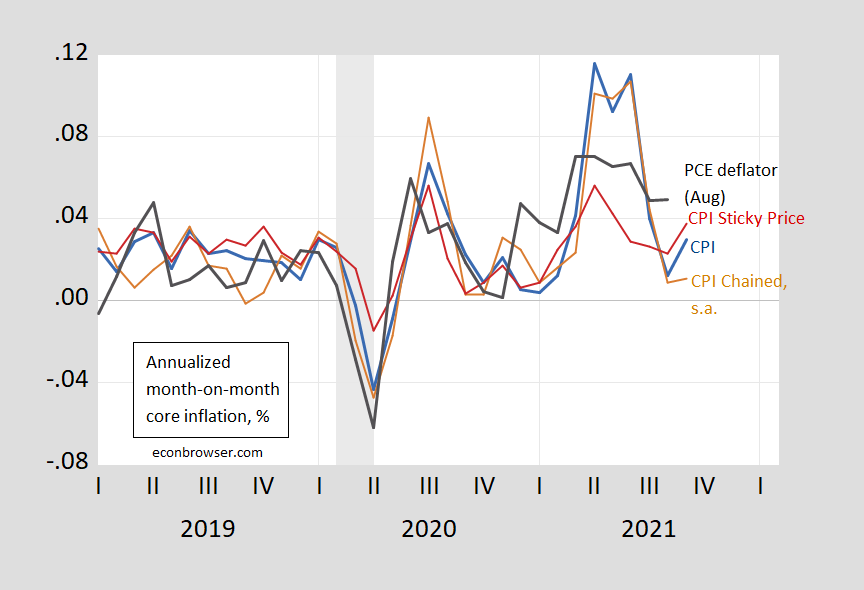
Figure 2: Month-on-month annualized inflation from CPI-all urban (blue), from personal consumption expenditure (PCE) deflator (black), chained CPI seasonally adjusted (brown), and sticky price CPI (green). Chained CPI inflation seasonally adjusted by author. NBER defined recession dates shaded gray. Source: BLS, Atlanta Fed, Cleveland Fed, via FRED, NBER, and author’s calculations.
Similar patterns pertain for core prices. So, with energy prices likely to be elevated (especially natural gas) and for food, it’s notable that core inflation (m/m) is up.
The m/m inflation can’t be attributed to re-opening pressures cited for previous months, as shown in CEA’s figure below:
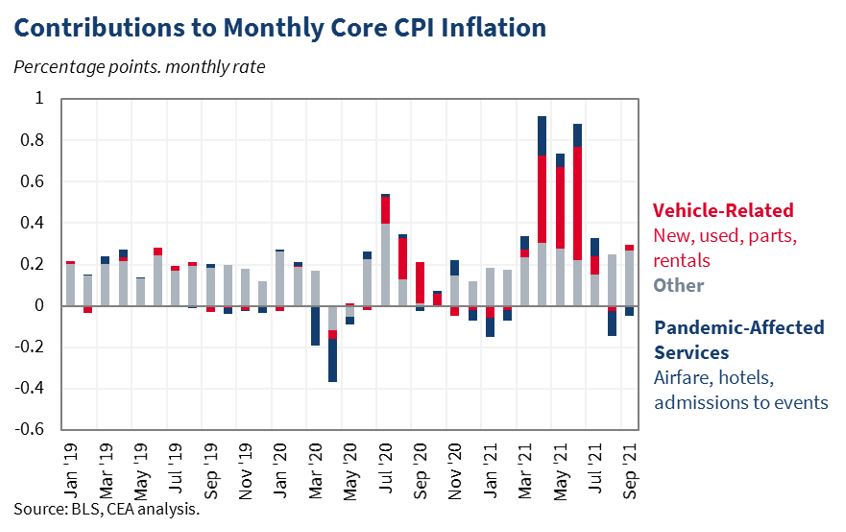
Source: CEA.
Inflation has persisted a bit more than anticipated earlier, as supply chain disruptions have pushed up prices. That being said, it’s important to remember when you hear that inflation has hit a 13 year high that characterization applies to the year-on-year comparison. Shorter horizons (like m/m) or 2-year horizon (to avoid base effects) yield different perspectives.
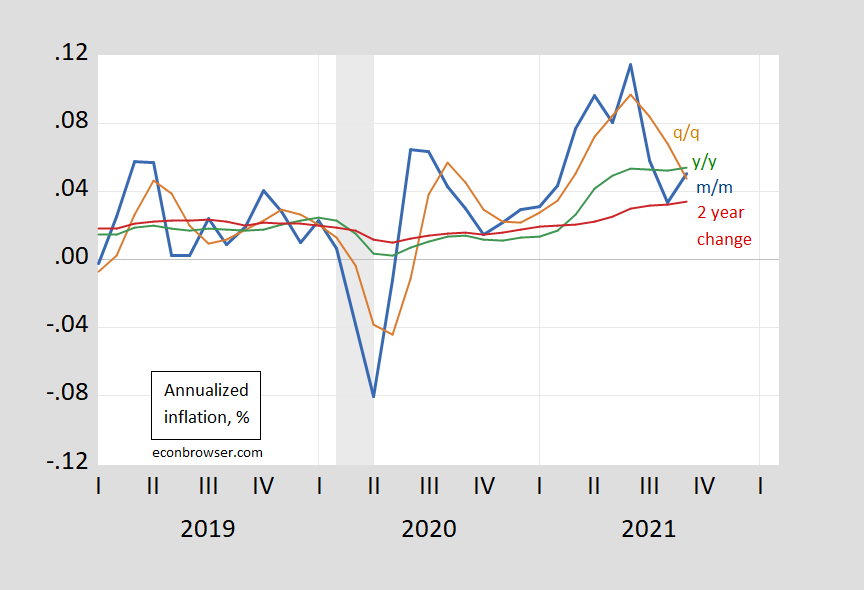
Figure 3: CPI inflation rate, month-on-month (blue), quarter-on-quarter (tan), year-on-year (green), and 12 month growth rate (red). NBER defined recession dates shaded gray. Source: BLS, NBER, and author’s calculations.
Finally, something that has been of concern is the housing component of the CPI. Inflation in owner-occupied equivalent rent and rent of primary residence has risen and is likely to continue to rise, given how the indices are constructed (the CPI rent component has been lagging measures like Zillow’s rent index).
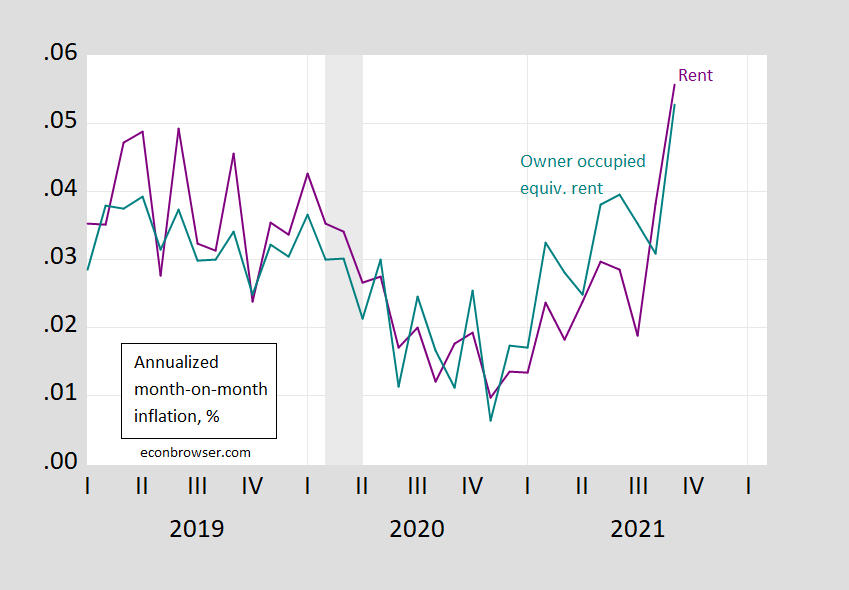
Figure 4: Rent of primary resident component of CPI (purple) and owner occupied equivalent rent (teal), both m/m annualized. NBER defined recession dates shaded gray. Source: BLS, NBER and author’s calculations.
OER and rent constitute about 30% of the total weights in the CPI.
Finally, it’s important to recall that the Fed targets average PCE inflation. PCE inflation is about 0.43 percentage points below CPI inflation from 2000 (both pre-pandemic and inclusive).
Disclosure: None.


