
CoT This Week: What Noncommercials, Hedge Funds Are Buying
Following futures positions of non-commercials are as of April 12, 2022.
10-year note: Currently net short 299.9k, down 62.9k.
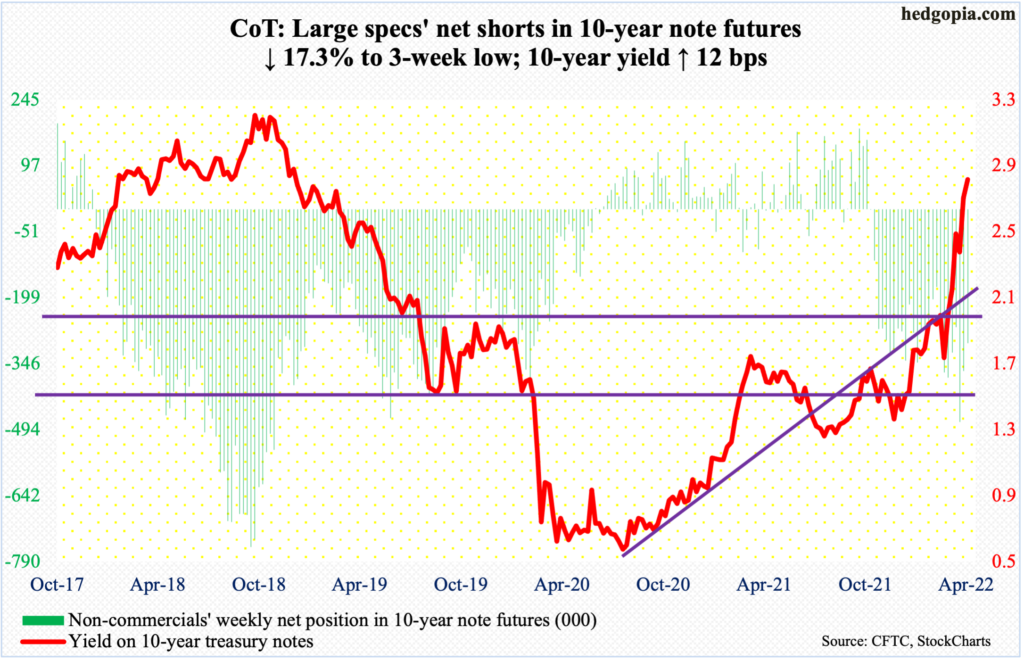
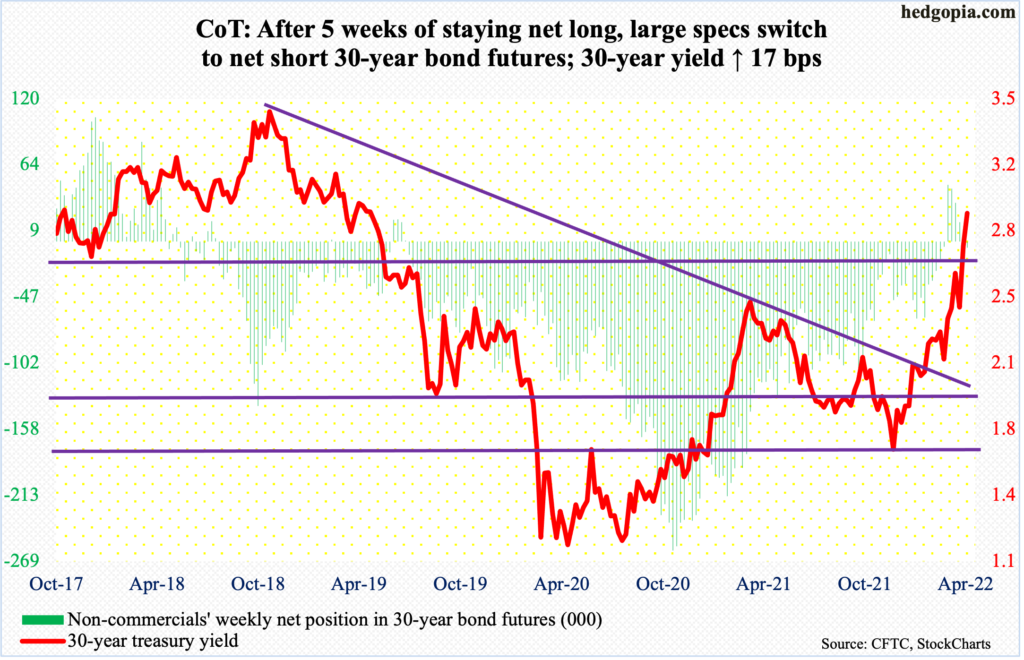
That the 10-year treasury yield has gone parabolic in recent weeks is no exaggeration. As recently as March 1, rates tagged 1.68 percent. Friday’s bullish marubozu session ended up 14 basis points to 2.83 percent, which is the highest print since December 2018. The 30-year (2.92 percent) similarly closed up 13 basis points this week to the highest since May 2019.
The long end of the curve is responding to inflation – both consumer and producer – at multi-decade highs and a hawkish reaction from the Fed. Fed funds futures have currently priced in rate increases of up to 300 basis points through July next year. The fed funds rate currently is in a range of 25 basis points to 50 basis points. In the upcoming May 3-4 meeting, a 50-basis-point hike is just about locked in.
Investors are leaving treasury notes and bonds in droves, pushing rates higher. It is too soon to say if the boat is dangerously tilted to one side, risking a tip-over; but should the current momentum persist, sentiment will get there sooner than later. Thirty-year fixed mortgage rates have reached five percent, versus under three percent last November. The spike in rates is bound to adversely impact housing, among others. The selloff in treasury notes and bonds is probably oblivious to these dynamics.
30-year bond: Currently net short 5.2k, up 6.4k.
Major economic releases for next week are as follows.
The NAHB housing market index (April) will be published on Monday. Homebuilder confidence in March dropped a couple of points month-over-month to 79 – a six-month low.
Housing permits (March) are on tap for Tuesday. Starts in February rose 6.8 percent m/m to a seasonally adjusted annual rate of 1.77 million units. This is the highest since June 2006.
Wednesday brings existing home sales (March). February sales declined 7.2 percent m/m to 6.02 million units (SAAR) – a six-month low. The median price in February increased 2.1 percent m/m to $357,300, which is just slightly off the all-time high of $362,900 set last June.
WTI crude oil: Currently net long 332.8k, down 2k.
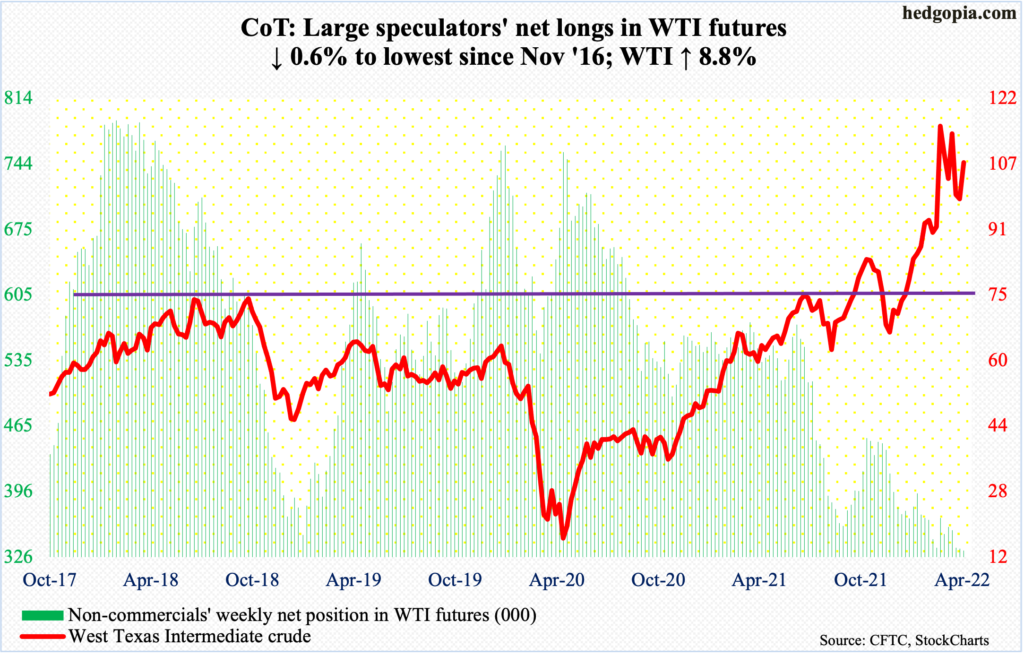
Last week, WTI ($106.95/barrel) successfully tested the lower support of a descending triangle it had been in since it peaked at $130.50 on March 7, ending oversold on the daily basis and with a weekly spinning top. This week, the crude jumped 8.9 percent. The support in question – at $94-$95 – was once again tested on Monday with an intraday low of $92.93, closing the session at $94.29. It then rallied the next three sessions, recapturing the 50-day moving average.
At least on the daily, there is room for more strength.
In the meantime, as per the EIA, US crude production in the week to April 8 was unchanged at 11.8 million barrels per day. Crude imports fell 305,000 b/d to six mb/d. As did stocks of gasoline and distillates, which respectively declined 3.6 million barrels and 2.9 million barrels to 233.1 million barrels and 111.4 million barrels. Crude inventory, however, increased – up 9.4 million barrels to 421.8 million barrels. Refinery utilization dropped 2.5 percentage points to 90 percent.
E-mini S&P 500: Currently net long 63k, up 94.6k.
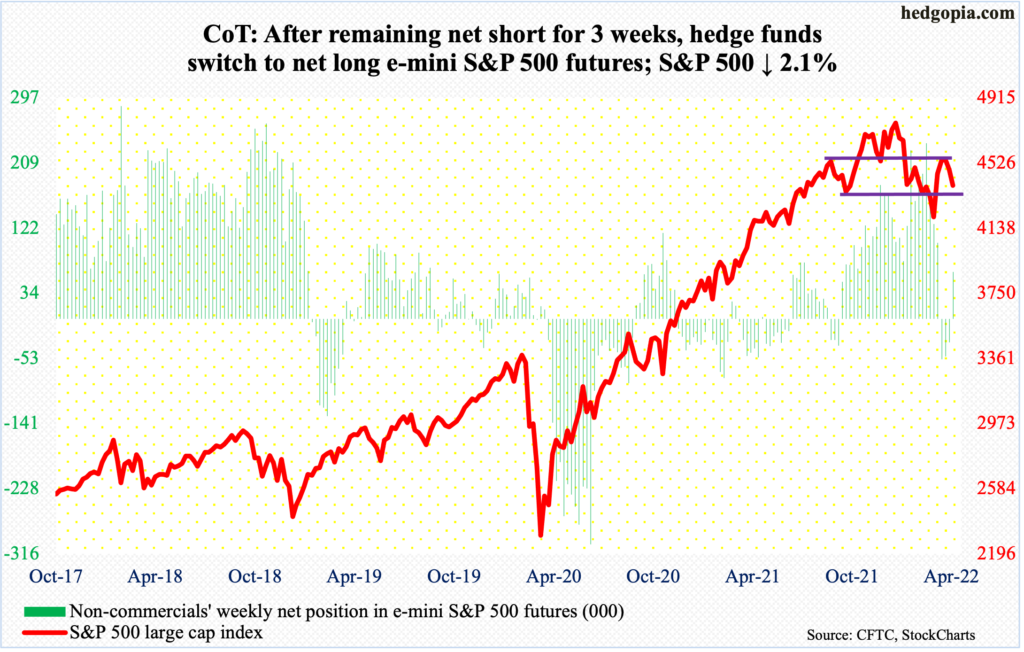
After gapping down on Monday to lose the 200-day, the S&P 500 in all four sessions this week straddled the 50-day, breaching the average (4418) on Friday. For the week, the large cap index (4393) gave back 2.1 percent – its second straight down week.
On the weekly, several indicators are turning back down from the median and could potentially continue lower. Concurrently, the daily is oversold, and this offers an opportunity for the bulls. They need flows to cooperate.
In the week to Wednesday, $9.6 billion came out of US equity funds (courtesy of Lipper). In the same week, SPY (SPDR S&P 500 ETF), VOO (Vanguard S&P 500 ETF) and IVV (iShares Core S&P 500 ETF) lost $4.9 billion (courtesy of ETF.com).
Non-commercials are betting the recent selloff will be over soon. They heavily switched to net long this week.
Medium- to long-term, margin debt is no longer acting as a tailwind. In March, it dropped $35.6 billion month-over-month to $799.7 billion, which is now down $136.2 billion from last October’s record $935.9 billion (chart here). The S&P 500 peaked this January at 4819, before dropping 14.6 percent to February’s intraday low of 4115. At last week’s close, it was down 8.8 percent from the high.
Euro: Currently net long 39.1k, up 11.7k.
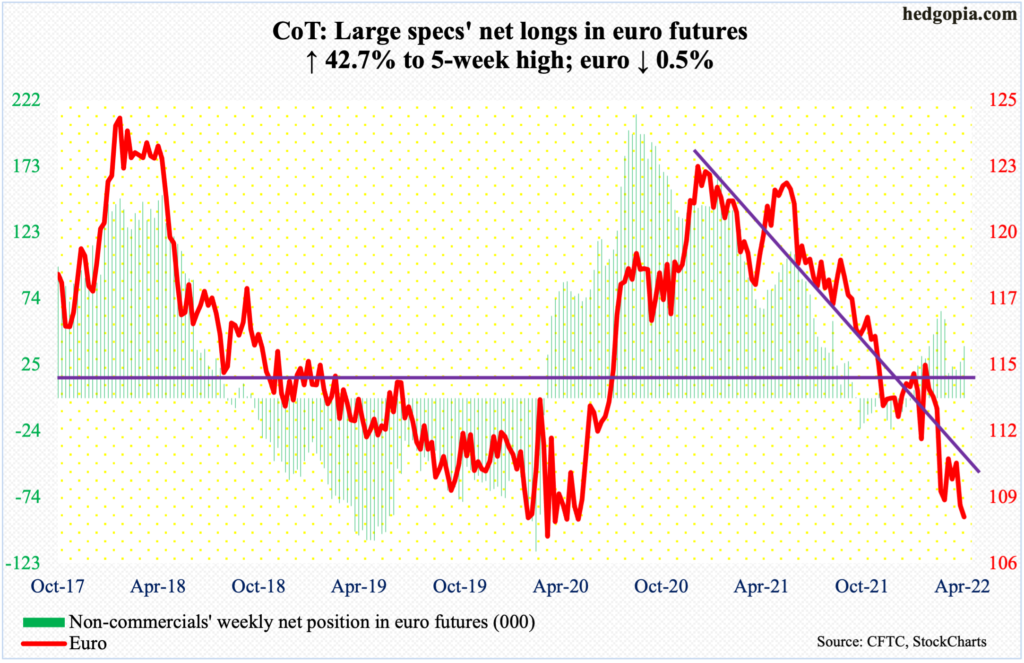
The euro came close to testing crucial straight-line support at $1.05-$1.06 this week. At Friday’s intraday low of $1.0757, the currency was down as much as 1.1 percent for the week but rallied to end the week down 0.45 percent to $1.0830.
Momentum remains down, which has been the case since the euro peaked at $1.2345 in January last year. Rally attempts have persistently failed. Most recently, after bottoming at $1.0845 on March 7, it rallied to $1.1172 by the 30th, before coming under renewed pressure.
Immediate resistance rests at $1.0840s, which is just slightly above where it ended the week. Reclaiming of the level will open the door toward $1.12.
Gold: Currently net long 254.3k, up 8.7k.
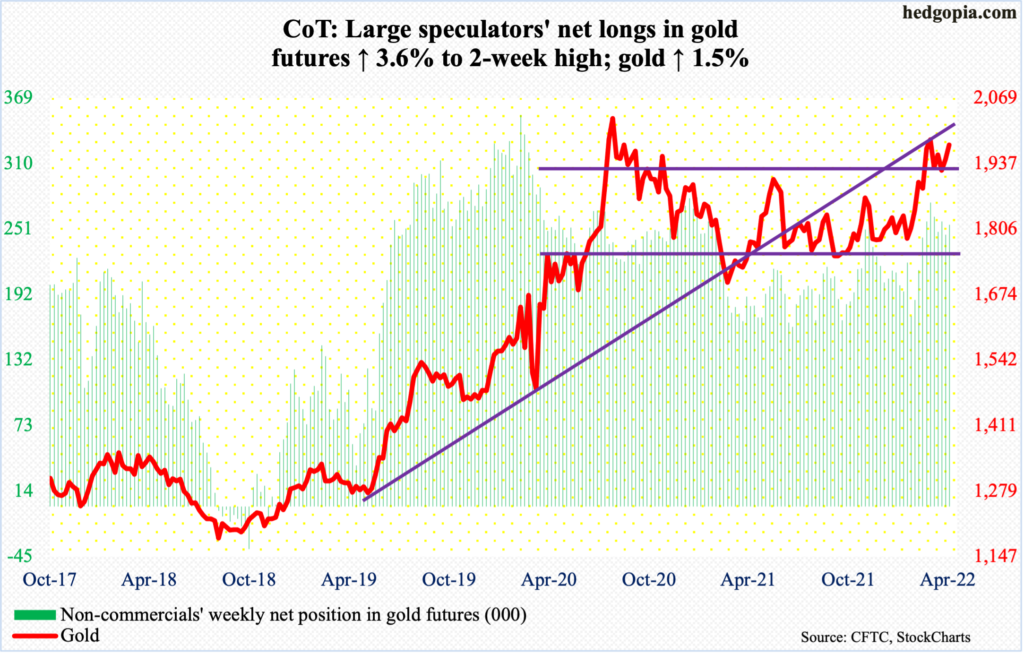
Gold bugs not only hung on to $1,920s this week but built on the recent momentum. The metal rallied 1.5 percent this week to $1,975/ounce.
In September 2011, gold retreated after tagging $1,924. It then bottomed in December 2015 at $1,045. That high was not surpassed until July 2020, followed by a new all-time high of $2,089 a month later.
Early last month, $1,920s was recaptured; by the 8th, bulls were less than $11 short of the August 2020 high, before sellers showed up. The metal has rallied since the 50-day was defended on March 29 with an intraday low of $1,893.
As things stand, a decisive takeout of $1,970s will open the door toward eventually testing the August 2020 high. Down below, there is support at $1,950s.
Nasdaq 100 index (mini): Currently net long 13k, up 21.6k.
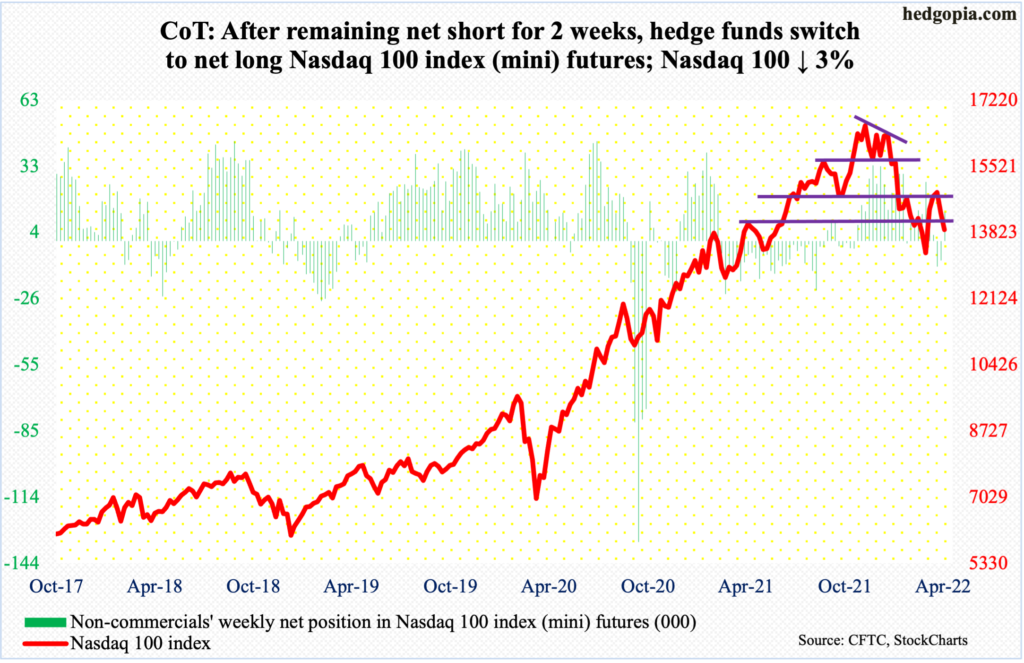
The week began with Monday’s gap-down breaching the 50-day. Late last month and early this month, the Nasdaq 100 was rejected at the 200-day and has been under pressure since. This week, the tech-heavy index (13893) lost three percent, for a second straight negative week.
The daily is oversold, but momentum is down. From bulls’ perspective, the sooner the 50-day is recaptured, the better. Else, bears will be eyeing the February-March lows just north of 13000.
Non-commercials are not betting on this scenario. They switched to net long this week.
Russell 2000 mini-index: Currently net short 43.2k, down 15.1k.
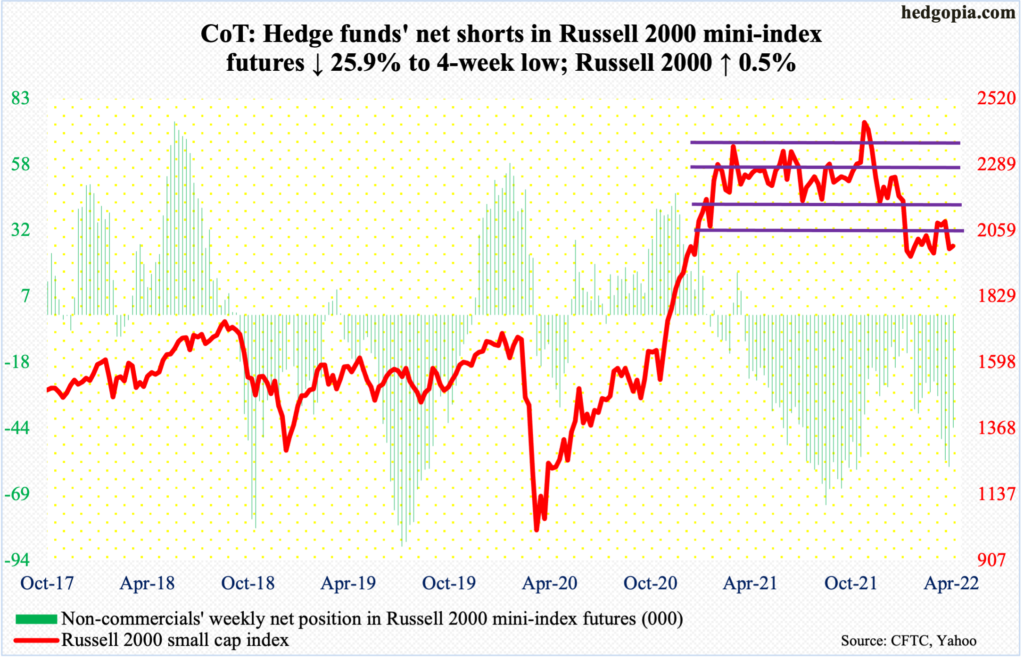
The Russell 2000 continues to go sideways just below where it suffered a major breakdown mid-January. The breakdown occurred at 2080s, which was the lower range of a months-long rectangle.
From March last year through January, the small cap index went back and forth between 2350s and 2080s, and between 2280s and 2150s within this box. On Nov 3, it broke out but was quickly followed by a failed retest on the 19th that month. Then came the breakdown in question mid-January; in the selling that followed, the index bottomed near 1900 in late January and late February.
Unlike the S&P 500 and the Nasdaq 100, the Russell 2000 (2005) last week drew bids – up 0.5 percent. Bulls should find this encouraging in the midst of an earnings season (more on this here), but the fact remains that the index remains trapped within a 200-point range – 1900 and 2100.
US Dollar Index: Currently net long 29.6k, down 2.2k.
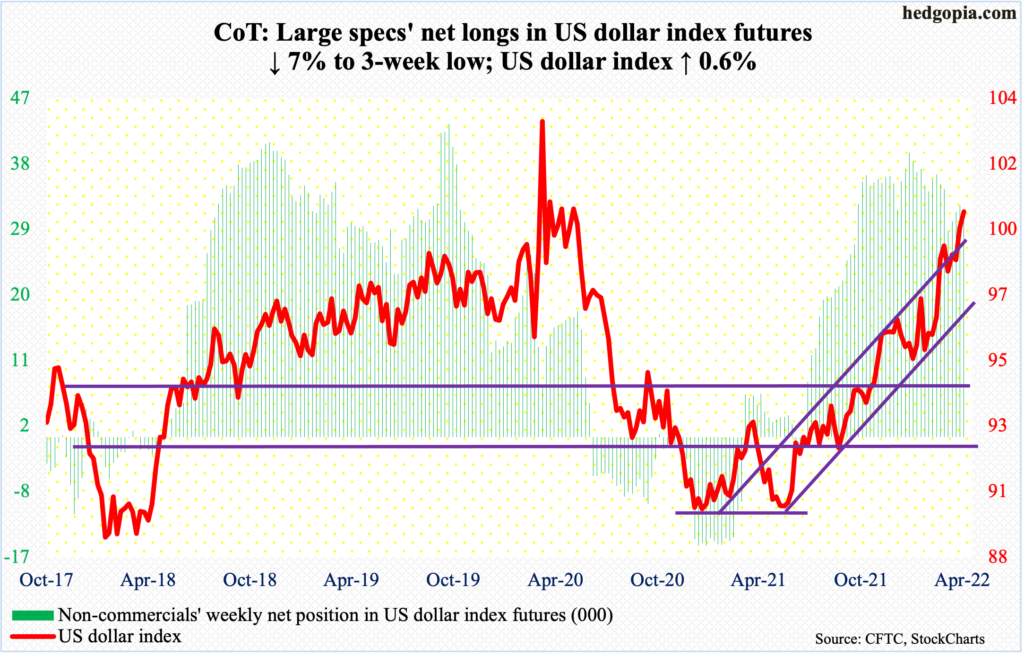
Friday saw a rather wild session, with a high of 100.77 and a low of 99.56, closing the week at 100.33, up 0.6 percent. This was the highest weekly close since May 2020. This week’s action followed last week’s mini-breakout at 99.40s.
Resistance at 100 goes back years – particularly the past seven years. A decisive breakout will be a huge development. Nevertheless, the US dollar index has been rallying since January last year when it ticked 89.17 and remains overbought on several timeframes.
VIX: Currently net short 81.4k, down 2.3k.
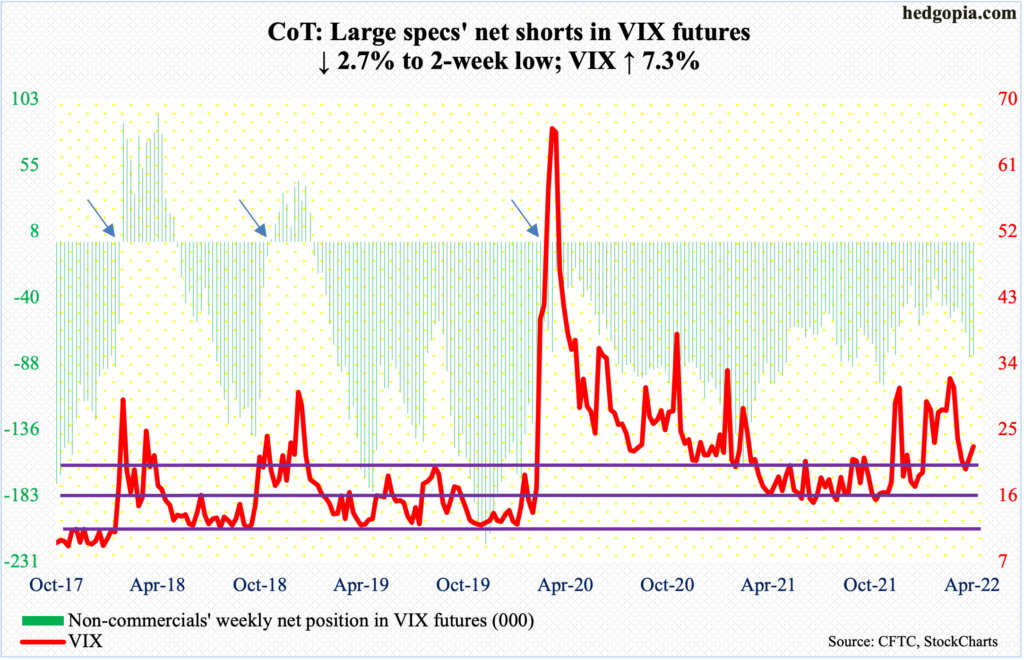
VIX is currently trapped between the 50- and 200-day. On Tuesday, the former drew offers, while on Friday the latter was defended.
Similarly, where the volatility index goes from here will be decided by if the daily or weekly indicators prevail. If the daily wins out, VIX (22.70) is headed lower near term. Tuesday’s high of 25.38 was also posted at mid-20s resistance.
For volatility to come under pressure, low-20s need to give way.


