
CoT This Week: The Future Via Futures, Noncommercial Positions
Following futures positions of non-commercials are as of July 6, 2021.
10-year note: Currently net short 25.6k, down 34.4k.
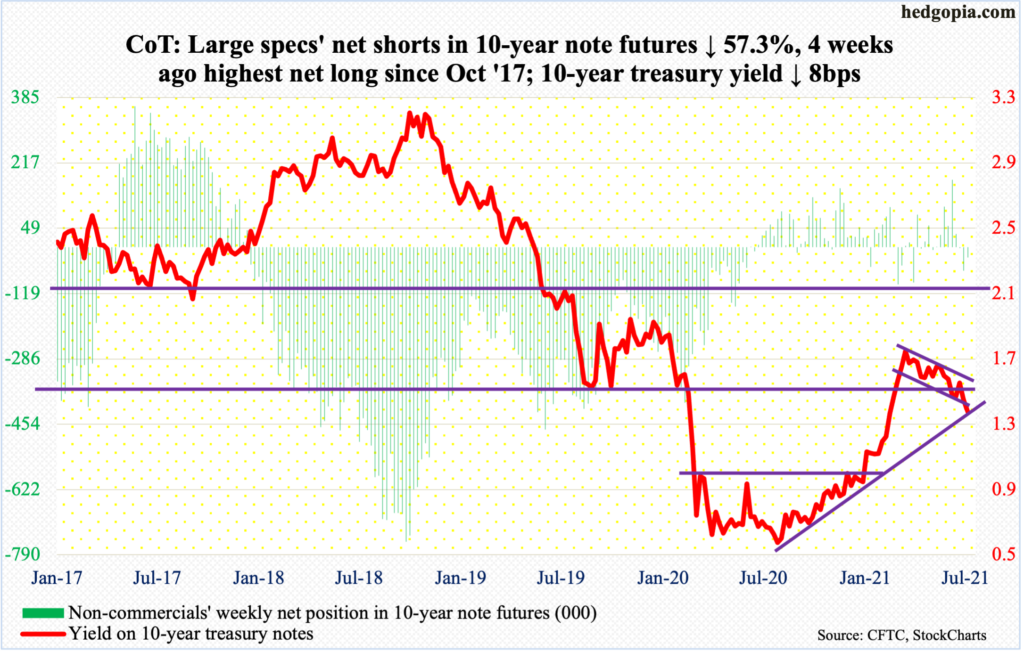
On Tuesday, slicing through low-1.40s, the 10-year (1.36 percent) broke not one, two but triple support – four-month descending channel, 11-month rising trend line and nine-year horizontal (more on this here). By the end of the week, rates rallied back to end right on the August ’20 trend line but the other two support levels have been compromised. This is potentially significant.
Early this year, yields broke out of one percent, before proceeding to rally to 1.77 percent by March 30.
On Thursday, the 10-year dropped as low as 1.27 percent, just above the 200-day moving average at 1.24 percent, before rallying. The daily is oversold. What transpires at the broken support will decide the fate of the next major move. In due course, odds of a drop to one percent cannot be denied.
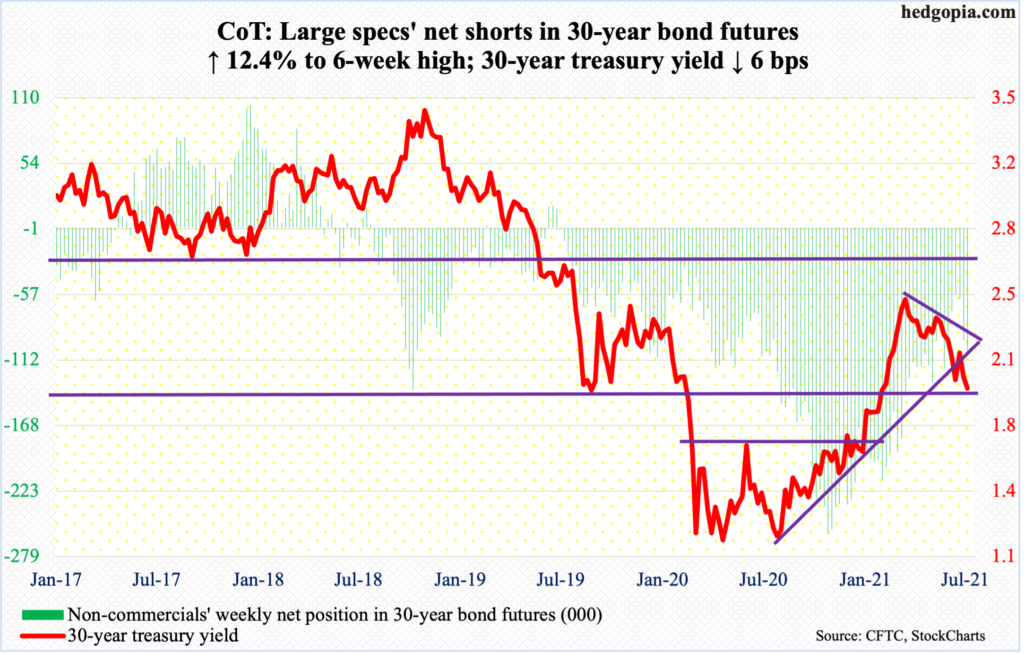
30-year bond: Currently net short 107.9k, up 11.9k.
Major economic releases for next week are as follows.
The NFIB Optimism Index (June) and the consumer price index (June) are scheduled for Tuesday.
Small-business optimism dropped two-tenths of a point month-over-month in May to 99.6. The all-time high of 108.8 was set in August 2018.
Headline and core CPI rose 0.6 and 0.7 percent m/m in May respectively. From a year ago, they respectively jumped five percent and 3.8 percent – the steepest since August 2008 and June 1992.
The producer price index (June) is due out on Wednesday. Producer prices rose 0.4 percent m/m in May and decreased 0.8 percent in the 12 months to May. Over the same time period, core PPI edged up 0.1 percent and fell 0.4 percent, in that order.
Industrial production (June) is on tap for Thursday. Capacity utilization in May rose 16.4 percent year-over-year to 75.2 percent – a 15-month high.
Friday brings retail sales (June), the University of Michigan’s consumer sentiment index (July) and Treasury International Capital data (May).
May retail sales fell 1.4 percent from April’s record $628.7 billion (seasonally adjusted annual rate). In April last year, sales saw a post-pandemic low of $409.8 billion.
Consumer sentiment increased 2.6 points m/m in June to 85.5 – a two-month high.
In the 12 months to April, foreigners’ net purchases of US stocks dropped a tad to $398.6 billion from record $406.4 billion in March.
WTI crude oil: Currently net long 512k, down 38.1k.
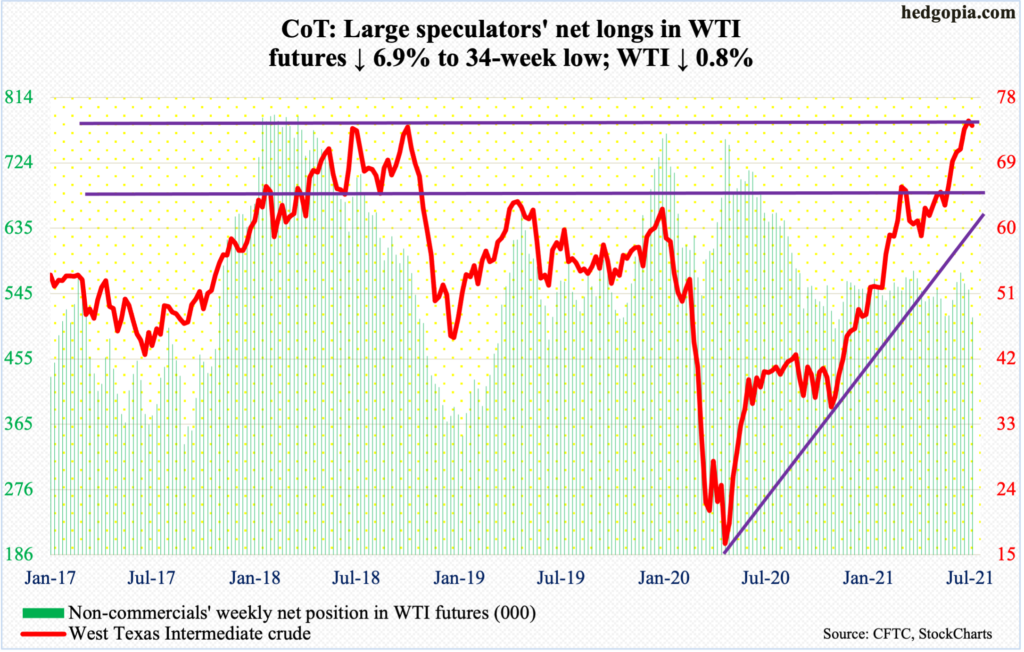
Barely had WTI ($74.56/barrel) surpassed the October 2018 high of $76.90 when sellers came out of the woodwork. On Tuesday, the crude rallied to $76.98 intraday but only to reverse hard and close at $73.37. By Thursday, it was down to $70.76 to find support at the daily lower Bollinger band.
The fact is that the reversal took place at importance resistance and on supposed good news from OPEC+, which on Monday postponed talks to resolve a disagreement over output policy. The United Arab Emirates blocked proposals to increase supply and extend the remaining production cuts to the end of 2022, instead of April 2022. As mentioned earlier, WTI did rally on this initially, but was unable to hold the gains.
Longs are sitting on tons of gains, with WTI having bottomed at $6.50 in April last year. Early last month, it broke out of horizontal resistance at $66-$67. A breakout retest is the path of least resistance. The 50-day at $68.87 lies just above that.
In the meantime, US crude production in the week to July 2 rose 200,000 barrels per day to 11.3 million b/d – a 58-week high. Crude imports dropped 531,000 b/d to 5.9 mb/d. As did stocks of crude and gasoline, which respectively fell 6.9 million barrels and 6.1 million barrels to 445.5 million barrels and 235.5 million barrels. Distillate stocks, however, rose 1.6 million barrels to 138.7 million barrels. Refinery utilization declined seven-tenths of a percentage point to 92.2 percent.
E-mini S&P 500: Currently net long 75.6k, up 20.4k.
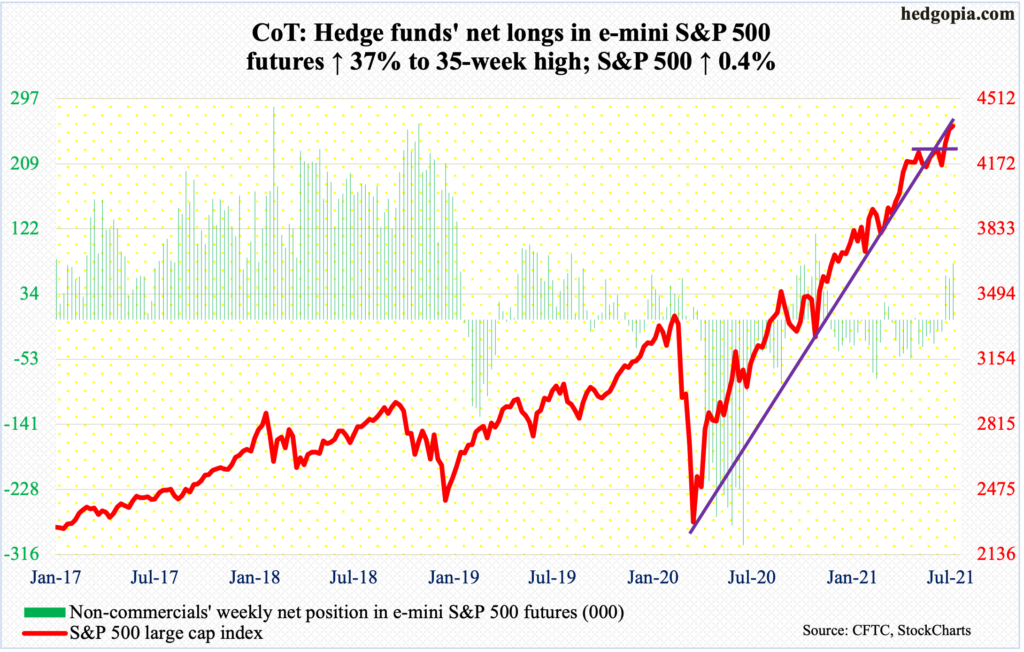
Eleven sessions ago, the S&P 500 broke out of 4250s, then rallying seven sessions in a row. The streak was broken on Tuesday, but the intraday weakness was well bid, in the process forming a hanging man. In the next session, intraday weakness once again was met with bids, resulting in another hanging man. These are potentially reversal candles. But bulls are not giving up. On Thursday, the large cap index was down as much as 1.6 percent intraday but recovered to end the session down 0.9 percent, resulting in a dragonfly doji. Friday’s 1.1-percent jump came in a bullish marubozu session, ending the week up 0.4 percent.
A hanging man also formed on the weekly.
The index has rallied strongly into 2Q earnings, which begins in earnest next week (more on this here). We are seeing some early signs of distribution, but selling is not persistent enough to overcrowd the buy-the-dip crowd. Post-earnings reaction is key.
In recent weeks, cash is coming out of money market funds, losing $101.3 billion in the past month, to $4.5 trillion (courtesy of ICI). The so-called cash-on-the-sidelines remains massive, and bulls hope these funds continue to bleed and that stocks get their fair share.
In the week to Wednesday, US-based equity funds lost $4.3 billion (courtesy of Lipper). In the same week, SPY (SPDR S&P 500 ETF), VOO (Vanguard S&P 500 ETF) and IVV (iShares Core S&P 500 ETF), however, took in $4.4 billion (courtesy of ETF.com).
Euro: Currently net long 77.2k, down 10k.
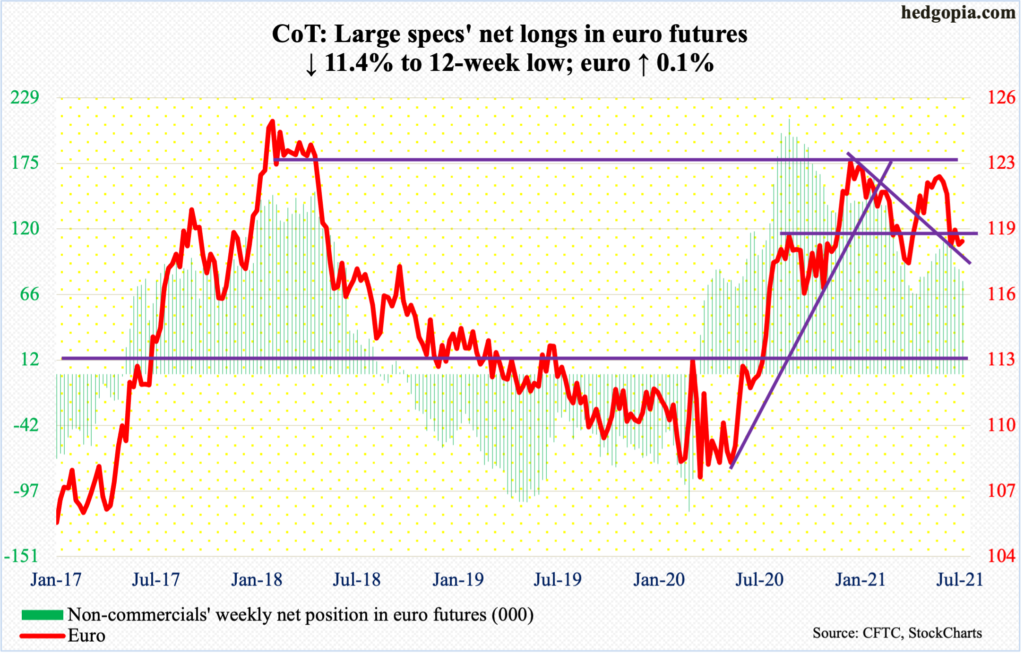
The recent downward momentum continued this week until the euro ($1.1882) put in a low of $1.1781 on Wednesday. The low was posted well before testing the March 30 low of $1.1712, for a higher low. The currency began dropping in late May after posting $1.2268 on the 25th.
The daily is oversold. A reflex rally is due. In fact, it has begun. In the last week of June, $1.19-$1.20 repelled rally attempts several times. This level goes back 18 years and was breached on June 17. This is the one to watch for now.
Gold: Currently net long 182.8k, up 20.6k.
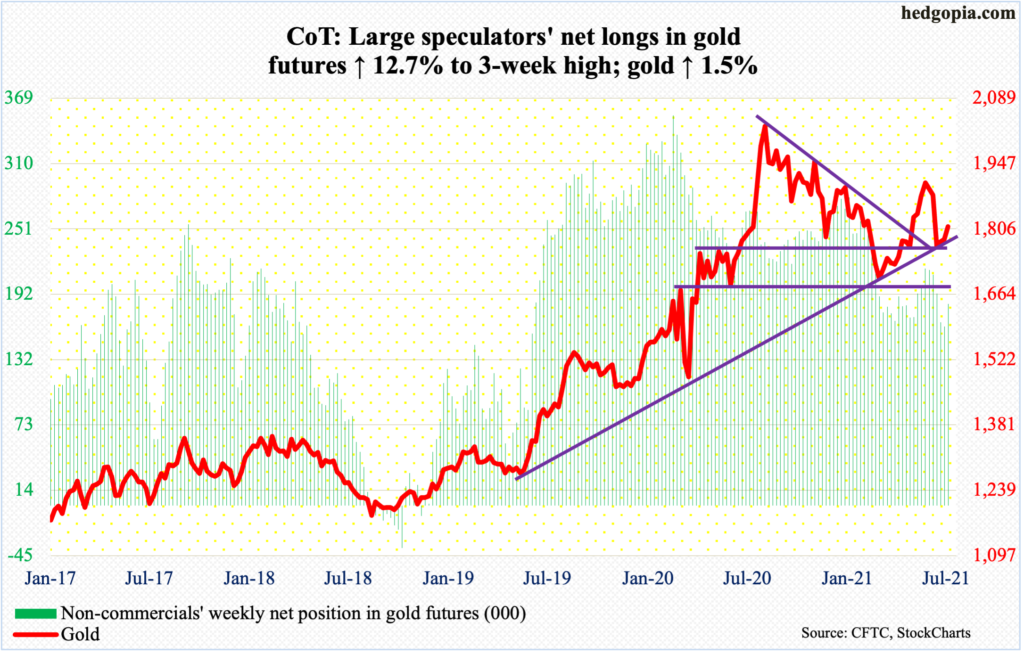
After defending $1,760s-$1,770s several times over a couple of weeks, gold bugs rallied the metal as high as $1,820 this week, which occurred on Thursday, but were not quite able to hold the highs. This was also the case in the prior two sessions. This action is understandable given the sharp hit gold ($1,811/ounce) took after getting rejected several times at $1,920s in the first half last month.
From gold bulls’ perspective, so long as $1,760s-$1,770s holds, damage repair can occur with the passage of time.
Immediately ahead, $1,800 is the line in the sand. Defense of this level can open the door toward the 50- and 200-day ($1,834 and $1,830 respectively).
Nasdaq 100 index (mini): Currently net short 1.6k, down 6.5k.
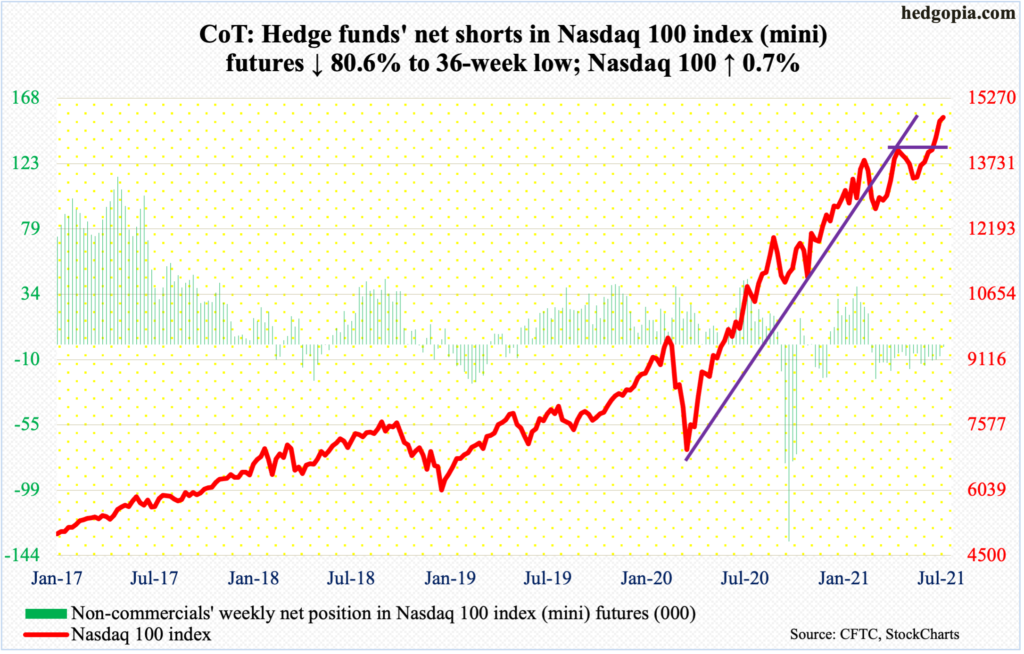
After a two-month consolidation, the Nasdaq 100 broke out of 14000 three weeks ago. By Wednesday this week, the tech-heavy index added nearly 900 points, ticking 14891. Shortly after that breakout, it rallied all along its sharply rising daily upper Bollinger band, driving the daily RSI into mid- to high-70s, which continues to be the case.
The weekly remains overbought as well, now up eight weeks in a row. Bulls hope frothy investor sentiment gets frothier (more on this here).
In the meantime, non-commercials in early June were net short 14.5k contracts. This week, they cut those down to 1.6k. They look ready to go net long. Time will tell if this will further act as a tailwind to the cash or will be used as an excuse to lock in gains.
Russell 2000 mini-index: Currently net short 41.9k, up 6.7k.
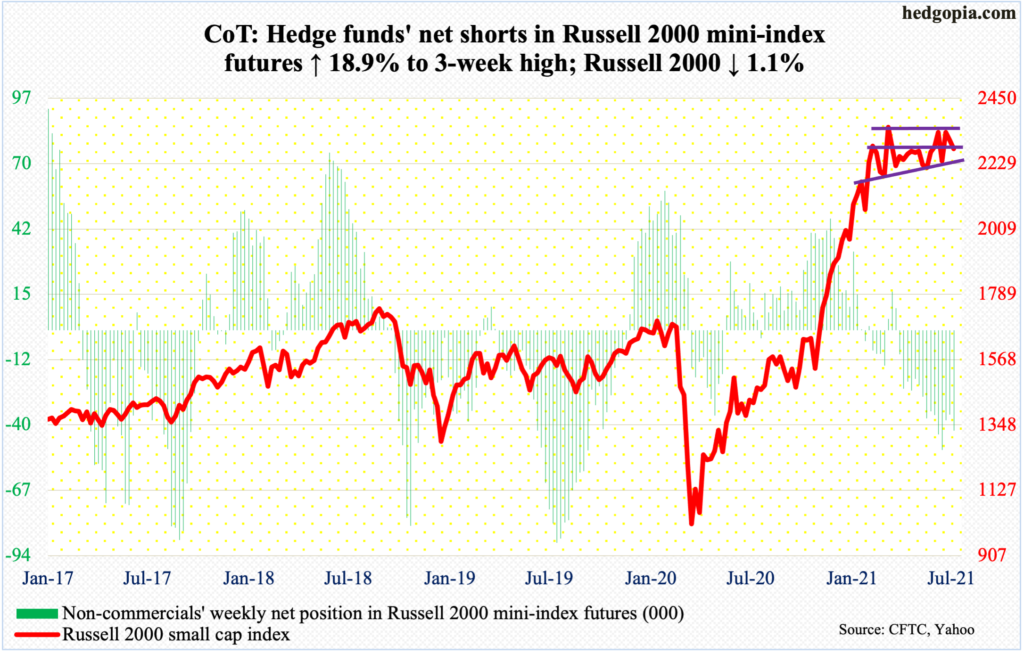
The Russell 2000 sort of unraveled this week but only to recover as quickly.
Since the small cap index got denied at 2350s-60s two weeks ago, sellers have outbid buyers. Nearest support lied at 2170s, which was a combination of six-month trend-line plus horizontal. On Thursday, bids showed up just above that, as the index tagged 2193 intraday. Bulls probably view this as consolation as the index ended down 1.1 percent for the week anyway, although it was down as much as 4.9 percent at Thursday’s lows. The index also managed to rally to horizontal resistance at 2280s.
So, for now, the index (2280) is trapped between 2280s and 2170s, with risk-reward odds probably skewed to the upside.
US Dollar Index: Currently net long 7.6k, up 8k.
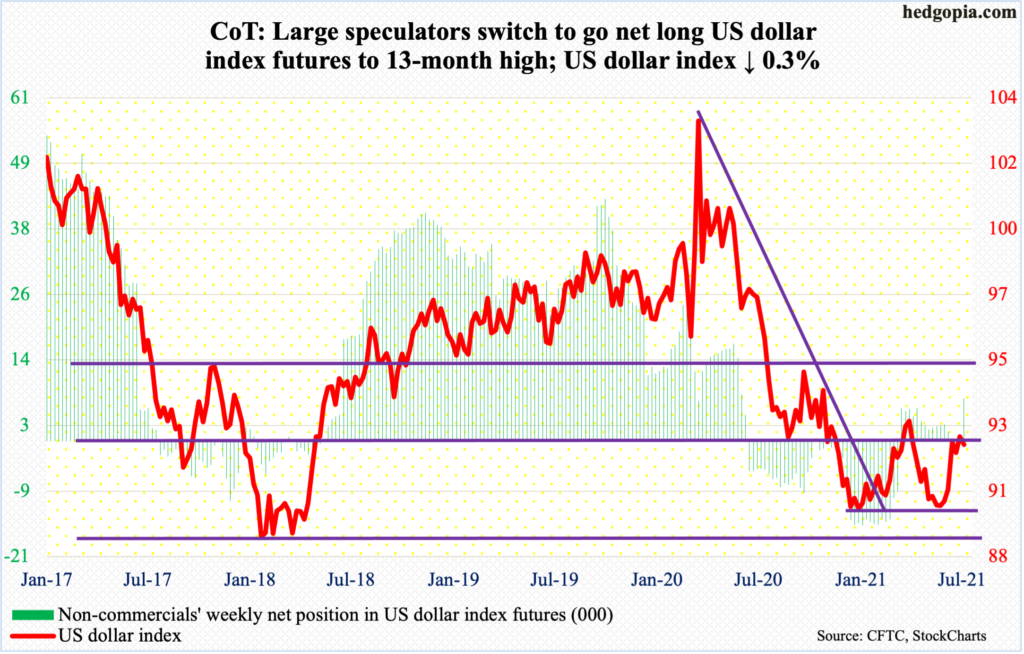
Dollar bulls could not quite keep the momentum going.
On Wednesday, the US dollar index (92.12) tagged 92.84 intraday, which was the highest print since April 5, and headed lower. Back then, on March 31 to be specific, it ticked 93.47 before reversing lower. The subsequent selling bottomed at 89.52 on May 25. This was an important defense of 88-89, which goes back at least 17 years.
Right here and now, odds favor weakness ahead. There is support just north of 92, a breach of which opens the door toward the 200-day at 91.51.
VIX: Currently net short 67.1k, up 407.
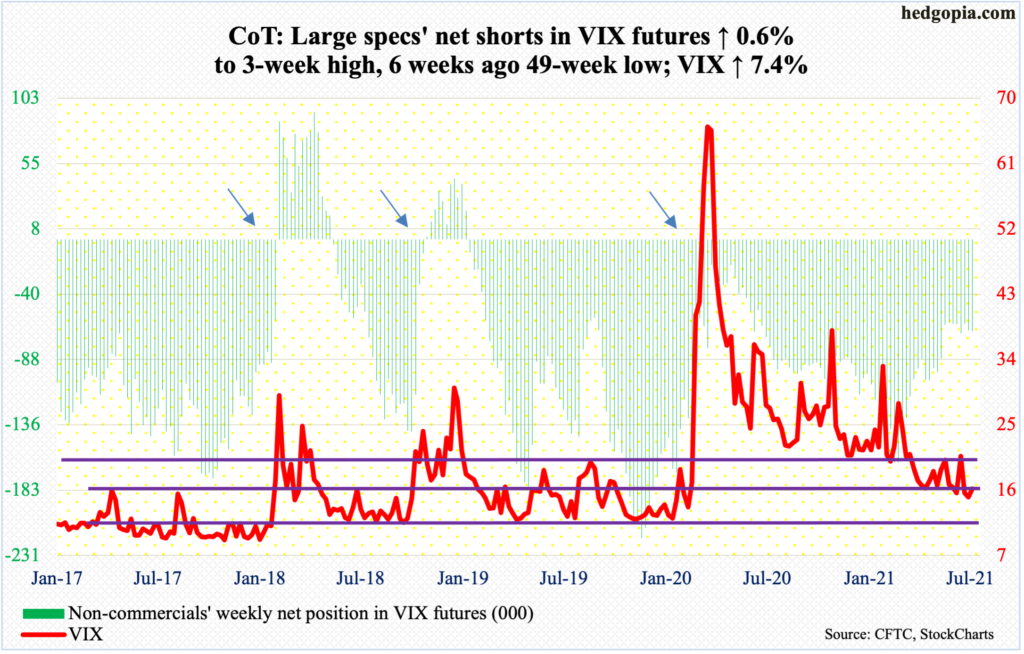
Several indicators on the monthly seem to want to rally. From volatility bulls’ perspective, the problem has been their inability to hold on to rallies.
VIX (16.18) has been posting a series of lower highs, a patten in place since it peaked at 85.47 in March last year. Its most recent high was set at 25.96 on May 19, followed by 21.82 on June 21. Yet again, on Thursday it rallied as high as 21.29 intraday but only to then weaken to close at 19. By Friday, it saw the 16 handle.
Amidst this, bulls have carved out decent support at 14-15, with the daily lower Bollinger band at 14.03.
Disclaimer: This article is not intended to be, nor shall it be construed as investment advice. Neither the information nor any opinion expressed here constitutes an offer to buy or sell any ...
more

