
CoT: The Future Through Futures, How Hedge Funds Are Positioned
Following futures positions of non-commercials are as of July 27, 2021.
10-year note: Currently net long 164.5k, up 75.6k.
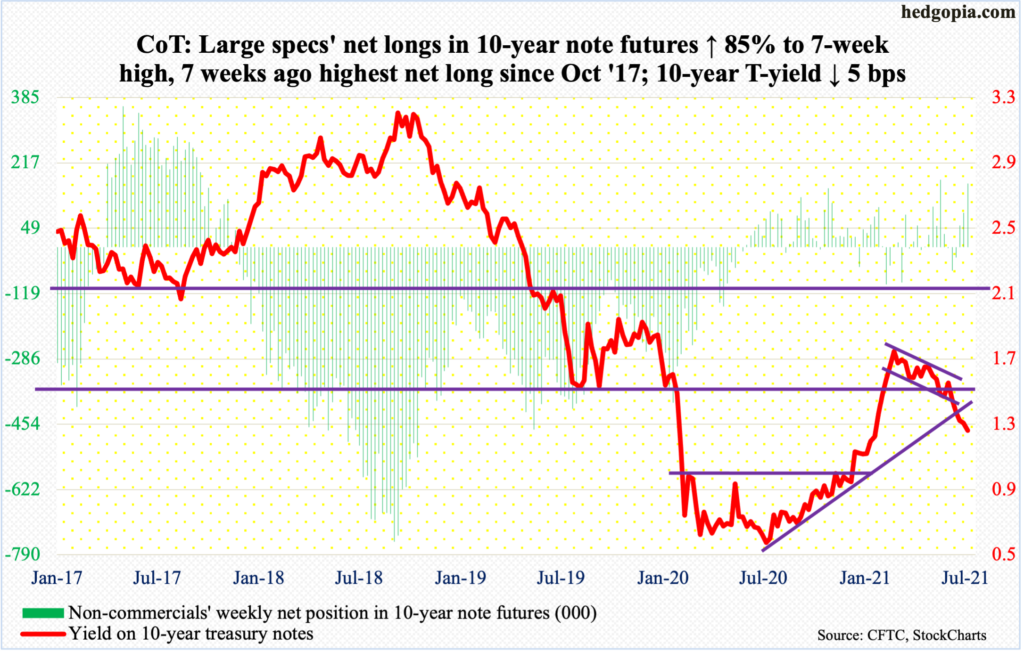
This week’s FOMC meeting was big yawn except for one thing. Members obviously left the fed funds rate at the current range of zero to 25 basis points. No one expected them to do anything with benchmark rates, and they did not.
Of late, the number of hawkish voices within the FOMC has been getting louder, although they continue to be in the minority. The likes of St. Louis Fed President James Bullard have begun to argue that the Fed should begin to taper its bond purchases.
Every month, the Fed buys up to $80 billion in treasury notes and bonds and $40 billion in mortgage-backed securities (more on this here). As of Wednesday, it held $8.2 trillion in assets, up from $4.2 trillion in early March last year.
Unlike the early months of last year when the economy was grinding to a halt and in response the Fed adopted an aggressive monetary policy, conditions have changed. The economy no longer needs an emergency policy.
During the June 15-16 FOMC meeting, members brought forward their projections for interest rate hikes into 2023, with 11 of them penciling in at least two quarter-point increases for 2023. Some are even calling for rate increases to begin next year.
With this as a background, this week’s FOMC statement further said that progress has been made towards the economic goals the Fed hopes to achieve before slowing down its bond buying. Previously, it had said it wanted to see substantial progress.
The slight tweak in the language suggests the Fed is probably getting ready to curtail the pace of purchases toward the end of this year. If so, repercussions will be felt across assets, not only US but global.
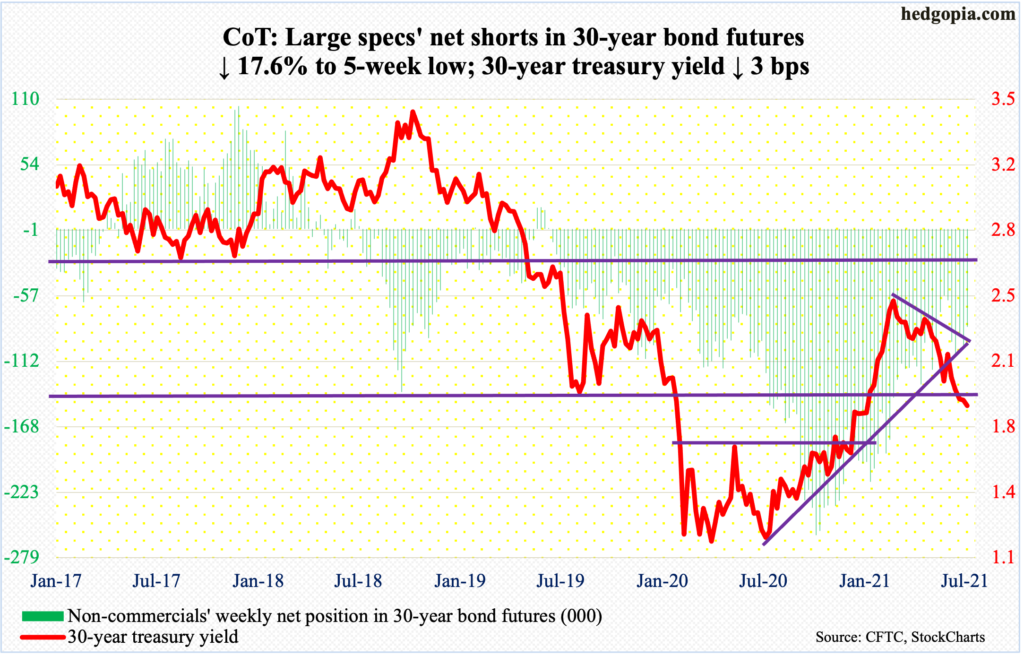
30-year bond: Currently net short 82.9k, down 17.7k.
Major economic releases for next week are as follows.
The ISM manufacturing index (July) is due out on Monday. Manufacturing activity fell six-tenths of a point month-over-month in June to 60.6. This was the fifth consecutive monthly reading of 60-plus – and in six out of the last seven.
Durable goods orders (June, revised) will be published on Tuesday. Preliminarily, June orders for non-defense capital goods ex-aircraft – proxy for business capex plans – jumped 18.3 percent year-over-year to a seasonally adjusted annual rate of $76.1 billion, which was a new record.
The ISM non-manufacturing index is on tap for Wednesday. Services activity in June dropped 3.9 points m/m to 60.1 – for four 60-plus monthly readings in a row.
Friday brings employment data (July). June created 583,000 non-farm jobs to 145.8 million, which represents gains of 15.6 million from April last year but still falls 6.8 million short of the pre-pandemic high of 152.5 million from February last year.
WTI crude oil: Currently net long 446.3k, down 4.1k.
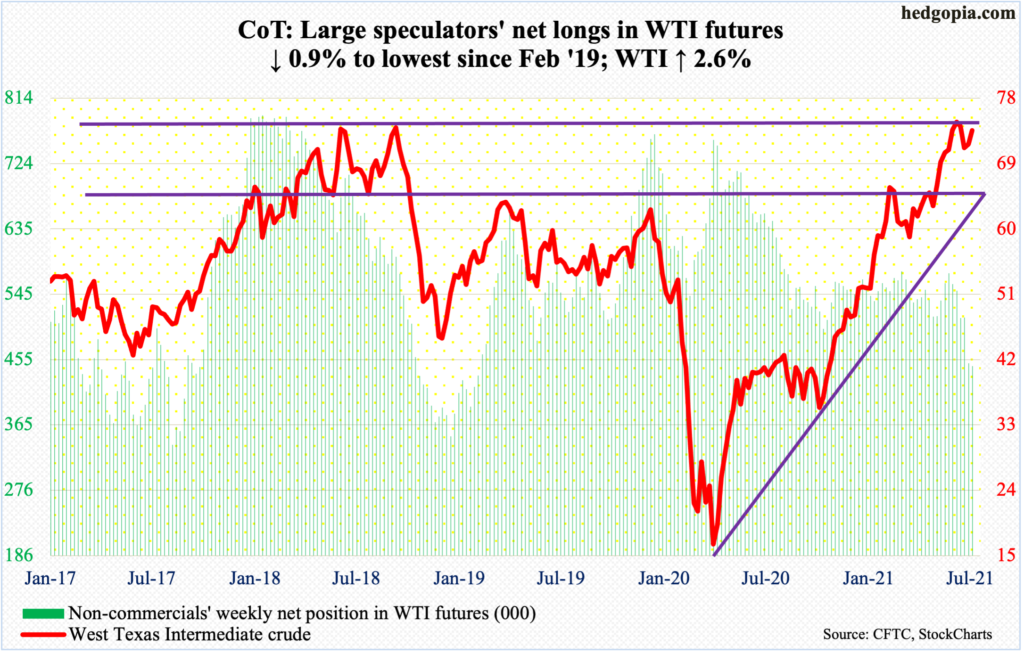
Bulls further built on last week’s defense of horizontal support at $66-$67. Last week’s weekly candle is proving to be a bullish hammer not a hanging man. Last week, WTI ($73.95/barrel) tumbled 7.2 percent, and was worse at the lows, before righting the ship as the week progressed.
This week, the crude rallied 2.6 percent. In ideal circumstances, bulls would love to go test the July 6 high of $76.98. In October 2018, WTI retreated after printing $76.90. So, this level has a lot of memory attached to it. A breakout would be massive. Before this level is tested, there is resistance at $75.50s.
In the meantime, US crude production in the week to July 23 fell 200,000 barrels per day to 11.2 million b/d. As did crude imports, which were down 590,000 b/d to 6.5 mb/d. Stocks of crude, gasoline and distillates all declined – respectively down 4.1 million barrels, 2.3 million barrels and 3.1 million barrels to 435.6 million barrels, 234.2 million barrels and 137.9 million barrels. Refinery utilization edged lower three-tenths of a percentage point to 91.1 percent.
E-mini S&P 500: Currently net long 39.4k, up 5.2k.
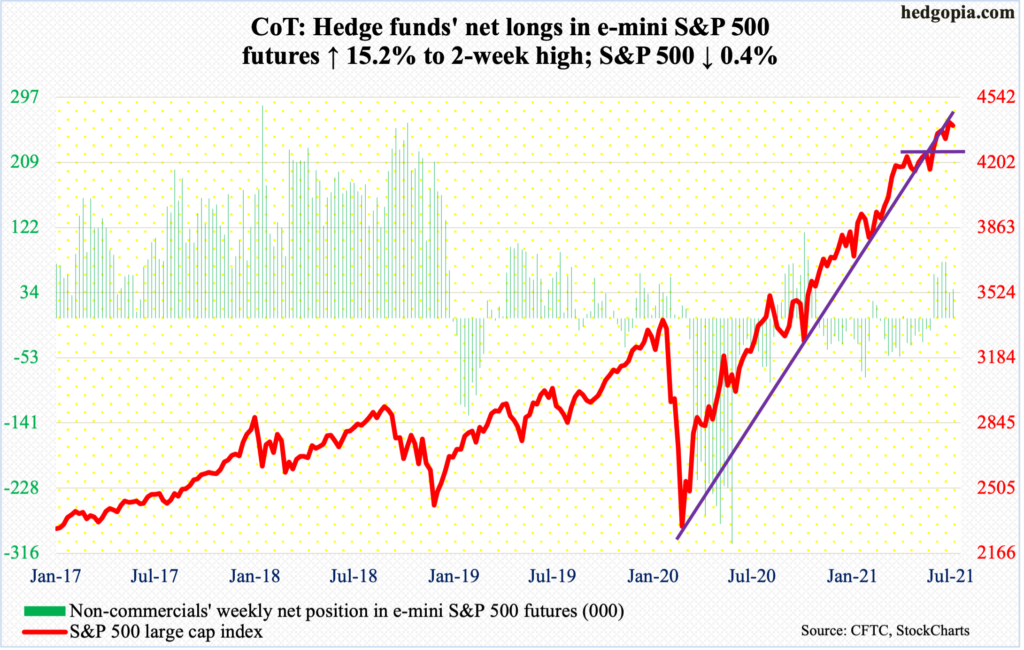
Last week’s bullish engulfing candle led to more gains this week early on, but bulls failed to hang on to those. At Thursday’s new all-time high of 4430, the S&P 500 was up 0.4 percent but in the end closed the week down by as much.
After last week’s bullish candle, bulls probably were not too thrilled with this week’s spinning top candle. This came in a week in which the top six US companies reported their June quarter (more on this below). With the earnings season two-thirds of the way, bulls are likely to struggle to find catalysts to push the large cap index (4395) higher.
The daily is now extended, with weekly and monthly in overbought territory for a while now.
Immediately ahead, there is support at 4370s, with the 50-day moving average at 4284. If 4420s get taken out, however, upside momentum can linger on.
Euro: Currently net long 38.1k, down 7.7k.
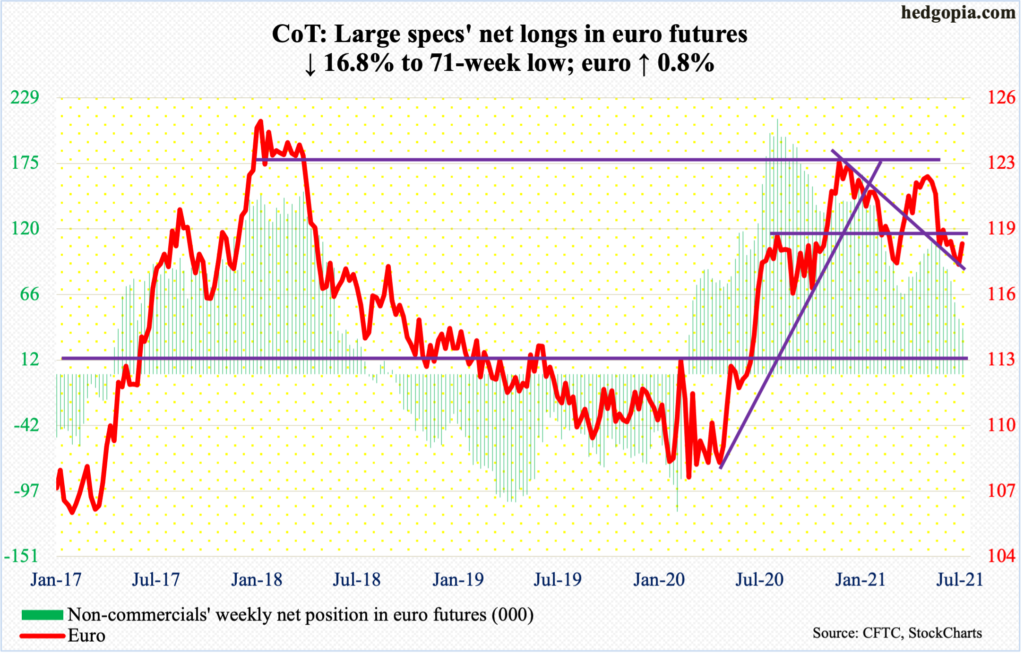
A higher low is in place. Last week’s intraday low of $1.1755 left the March 30 low of $1.1712 intact. The euro ($1.1870) this week rallied strong, up 0.8 percent – past nearest resistance at $1.1840s.
At this juncture, $1.19-$1.20 may just act like a magnet. In the last week of June, this level repelled rally attempts several times. It goes back 18 years and was breached on June 17. This is the one to watch for now.
In fact, the currency touched $1.1898 intraday Friday before retreating.
Gold: Currently net long 199.4k, up 3.4k.
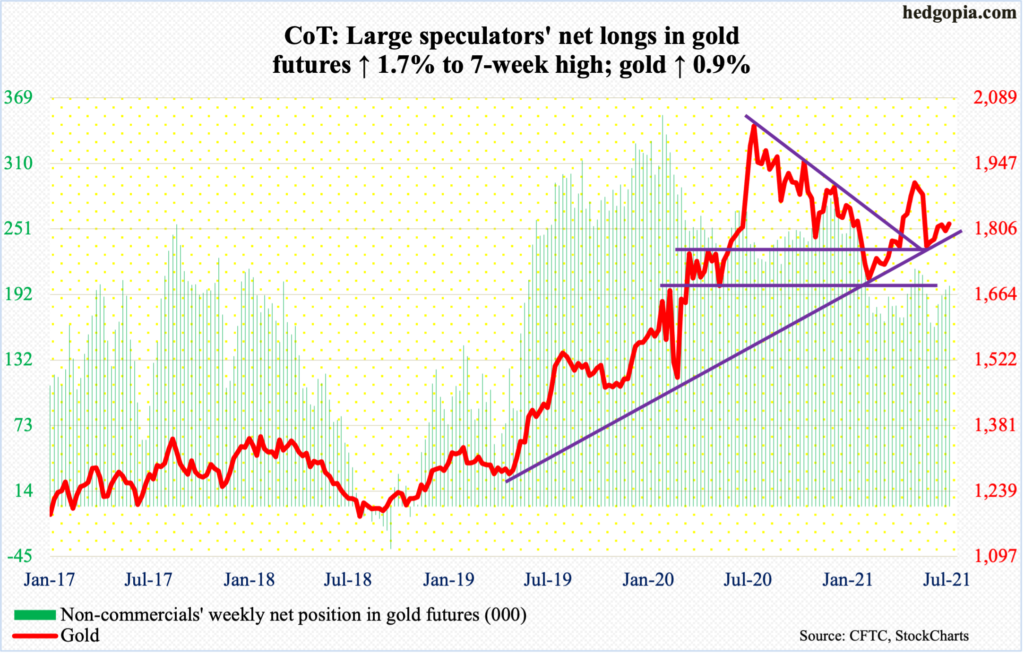
Gold bugs continued to defend $1,800 early this week, setting up a foundation for Thursday’s two-percent jump past the 200-day. Above, there is resistance at $1,840s, followed by the all-important $1,920s, which is where gold ($1,817/ounce) peaked in September 2011. Several times in the first half in June, the metal got rejected at this ceiling. Last August, gold went on to post a new high of $2,089 but the breakout proved fleeting.
Thursday’s high of $1,838 just about tested $1,840s resistance, which is holding. The 200-day was lost on Friday.
Nasdaq 100 index (mini): Currently net short 9.8k, up 7.5k.
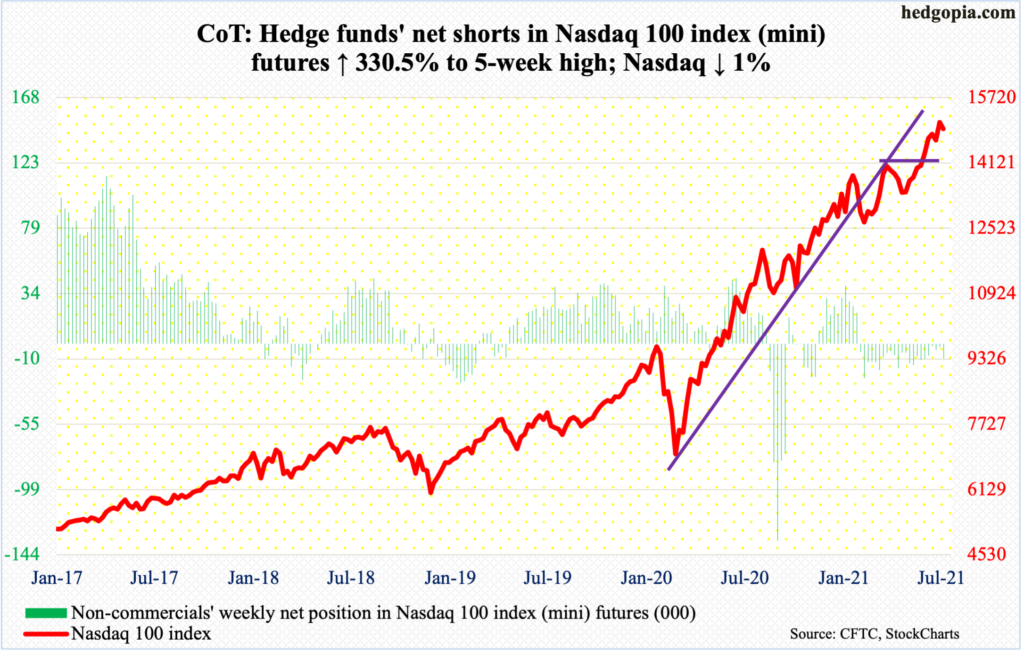
Of the top six US companies – all tech – reporting their June quarter this week, only Tesla (TSLA) closed the week up. The rest – Apple (AAPL), Microsoft (MSFT), Amazon (AMZN), Alphabet owner Google (GOOG) and Facebook (FB) – ended in the red, with AMZN tumbling nine percent. For the most part, results – both top and bottom line – were better than consensus estimates, but these stocks, except for TSLA, had also rallied strongly into earnings.
This week, MSFT, GOOG and FB rallied to new highs before reversing; AAPL came close to surpassing its July 15 high.
The point is, the leading ones are giving out signs of fatigue. As to the Nasdaq 100 (14960), after last week’s bullish engulfing candle, the index rose to a new intraday high of 15142 on Monday but ended the week down one percent anyway.
Immediately ahead, there is support at 14900, which held on Friday but in all probability will be tested again in the sessions ahead.
Russell 2000 mini-index: Currently net short 56.9k, up 822.
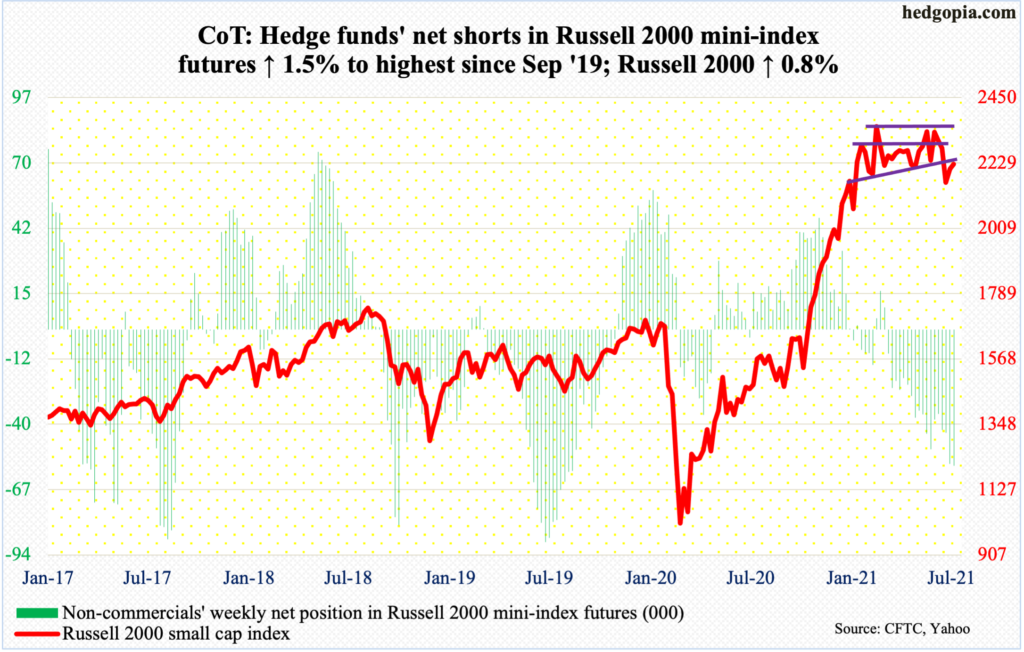
Last week, small-cap bulls defended the lower bound of a five-month range. The Russell 2000 (2226) has been playing ping pong between 2350s and 2080s. The small cap index has been consolidating after a massive rally from the lows of March last year.
After last week’s defense of 2080s, bulls have an opportunity to go attack the upper bound but before that they face strong resistance at 2280s.
In the meantime, non-commercials are sitting on tons of net shorts. A range breakout could force them to close their positions, putting upward pressure on the cash.
Regardless how things evolve on an absolute basis, it is possible small-caps begin to outperform on relative terms versus their large-cap brethren. The ratio of Russell 2000 to the S&P 500 closed last week on dual support (more on this here); this week, it rallied one percent and could be itching to move higher.
US Dollar Index: Currently net long 16.5k, up 4.4k.
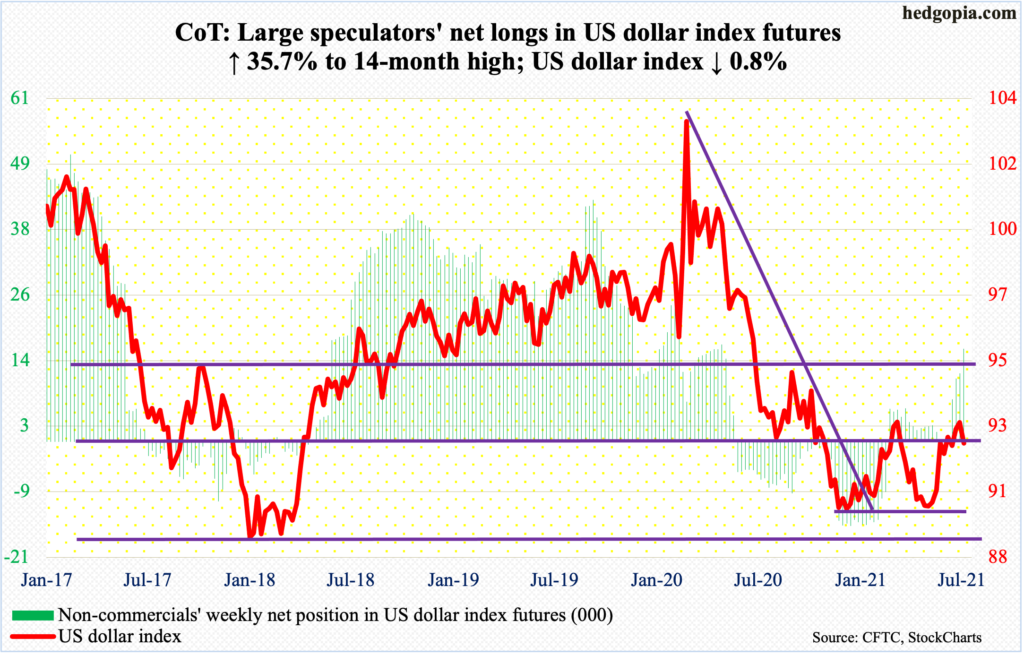
The US dollar index (92.19) fell in the first four sessions this week and was down on Friday as well early on but only to then reverse higher. For the week, it was down 0.8 percent.
Last week’s high of 93.20 set a lower high versus the March 31 high of 93.47. On the way down, dollar bulls were unable to save important support just north of 92 but managed to close the week right on it. This level goes back to June 2003 – a make-or-break for now.
Non-commercials are increasingly betting that the index rallies here.
VIX: Currently net short 52.1k, up 1.3k.
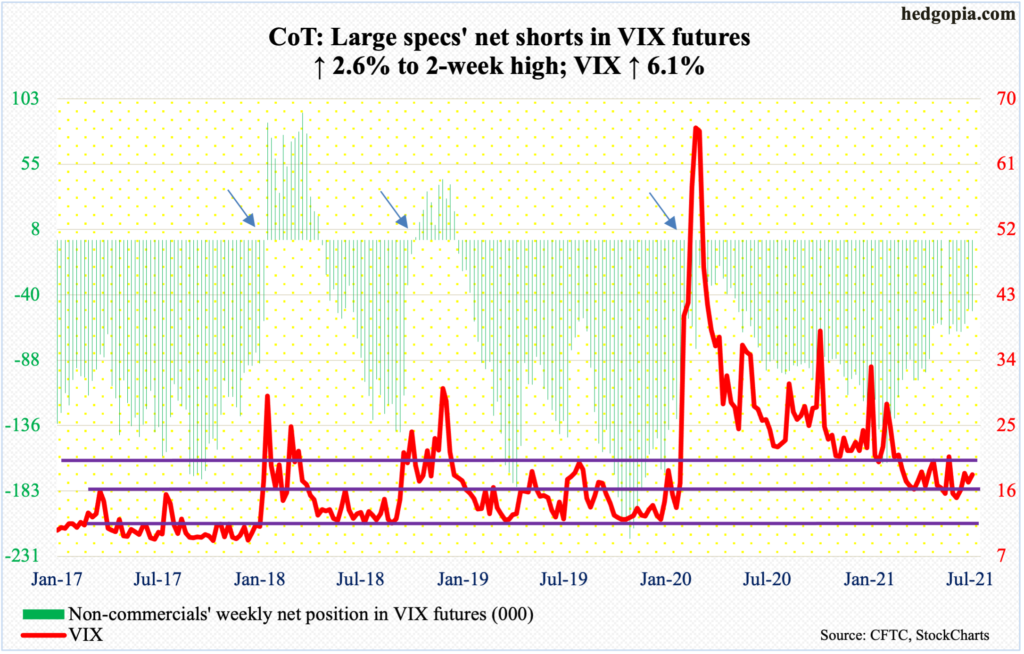
A rising trend line from late June is intact. Thursday’s low of 17.19 tested that support and held. On both Thursday and Friday, the 50-day, which is now flattish, was tested successfully.
Concurrently, rallies keep getting sold at progressively lower levels. This has been going on since March last year when VIX (18.24) ticked 85.47 before reversing. The most recent high was established on July 19 when the volatility index tagged 25.09. There is this, though. That high was yet another lower high going back to March last year but a higher high versus 21.82 from June 21 or 21.29 from July 8. VIX now needs to take out the July 19 high to establish a pattern of higher lows/higher highs.
The monthly continues to act like it wants to rally.
Disclaimer: This article is not intended to be, nor shall it be construed as investment advice. Neither the information nor any opinion expressed here constitutes an offer to buy or sell any ...
more

