
CoT: Looking At The Future Thru Futures, July 12
Following futures positions of non-commercials are as of July 7, 2020.
10-year note: Currently net long 43.2k, up 12.2k.
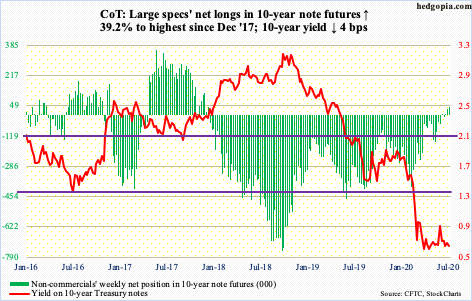
The 10-year Treasury yield is clinging on to support. It shed four basis points this week to close at 0.63 percent; Friday, it dipped as low as 0.57 percent.
Since bottoming on March 9th at 0.40 percent, the 10-year has pretty much been going back and forth between 0.73 percent and 0.59 percent. Bond bears (on price) defended the bottom of the range Friday.
Of late, non-commercials have been betting that the risk is to the downside on rates. As recently as five months ago, they were net short 398,919 contracts in 10-year note futures. By June 9th, they were net long 2,254 contracts, with this week at 43,187.
Concurrently, for 13 straight weeks through this Wednesday, taxable bond funds attracted $121 billion (courtesy of Lipper). Perhaps importantly, TLT (iShares 20+ year Treasury Bond ETF) three weeks ago broke out of a weekly pennant.
A lot of money is betting on lower rates. It probably is early to take a contrarian view.
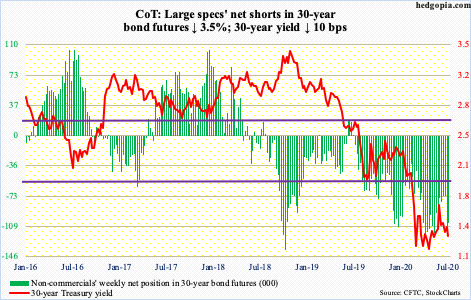
30-year bond: Currently net short 105.1k, down 3.8k.
Major economic releases next week are as follows.
Tuesday, the NFIB optimism index (June) and the CPI (June) are scheduled.
Small-business optimism rose 3.5 points month-over-month in May to 94.4. April’s 90.9 was a seven-year low.
Both headline and core consumer prices in May edged down 0.1 percent m/m. In the 12 months to May, they respectively rose 0.1 percent and 1.2 percent.
Industrial production (June) is due out Wednesday. Capacity utilization in May inched up 1.3 percent m/m to 64.8 percent. April’s 64 percent was the lowest ever going back to January 1967.
Retail sales (June), the NAHB housing market index (July) and Treasury International Capital data (May) will be out Thursday.
Retail sales in May jumped 17.7 percent m/m to a seasonally adjusted annual rate of $485.5 billion. Sales peaked in January at $529.6 billion, dropping to $412.6 billion by April.
Builder sentiment shot up 21 points m/m in June to 58. Before this, the index dropped to 30 in April from 76 last December.
In the 12 months to April, foreigners purchased $79.2 billion in US equities, down from $83.5 billion in March. This is quite a turnaround from April last year when they sold $214.6 billion worth – a record.
Friday brings housing starts (June) and the University of Michigan consumer sentiment index (July).
Housing starts increased 4.3 percent m/m to 974,000 units (SAAR). April’s 934,000 was the lowest since February 2015.
June consumer sentiment increased 5.8 points m/m to 78.1. Between February and April, sentiment swung from 101 to 71.8.
WTI crude oil: Currently net long 643.6k, down 12.6k.
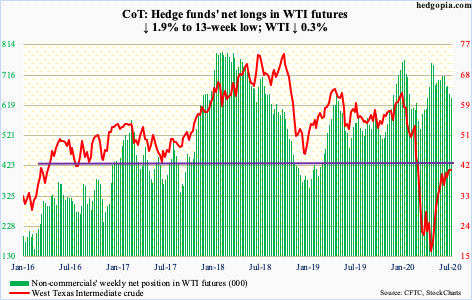
WTI ($40.55/barrel) continued to trade around its 10- and 20-day moving averages, which have gone flat and which increasingly are at risk of rolling over. The crude has rallied hard since bottoming at $6.50 on April 21st and has gone sideways since filling a gap from early March five weeks ago.
On the weekly, the RSI has gone sideways around the median for six weeks and looks ready to turn back down. Nearest support on WTI lies at $36-37.
In the week to July 3rd, as per the EIA, US crude and distillate stocks rose 4.8 million barrels and 3.1 million barrels respectively to 539.2 million barrels and 177.3 million barrels. Crude imports increased as well, rising 1.4 million barrels per day to 7.4 mb/d. Gasoline stocks, however, dropped 4.8 million barrels to 251.7 million barrels. Refinery utilization rose two percentage points to 77.5 percent. Crude production was flat at 11 mb/d.
E-mini S&P 500: Currently net short 36.2k, down 13.4k.
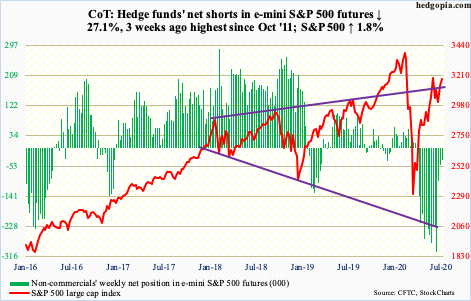
Until Monday’s breakout, the S&P 500 was rejected at 3150s for three weeks. The breakout opened the door to filling a gap from June 11th. After the index tagged 3184.15 on Tuesday, bulls struggled to save the breakout. Thursday, in fact, it was down as much as 1.7 percent intraday to 3115.70 but recovered to close down 0.6 percent; bulls defended the 10-day. Friday, it once again shook off morning weakness to end up 1.1 percent to 3185.04 – right at that gap fill. Bulls are probably eyeing 3233.13, which was hit on June 8th.
Non-commercials continue to cover their shorts, which three weeks ago had surged to the highest since October 2011, and that has helped the bulls. Otherwise, fund flows have not been in cooperation.
In the week to Wednesday, another $1.5 billion came out of US-based equity funds (courtesy of Lipper). In the same week, SPY (SPDR S&P 500 ETF), VOO (Vanguard S&P 500 ETF) and IVV (iShares Core S&P 500 ETF) collectively gained $458 million (courtesy of ETF.com).
Euro: Currently net long 103.6k, up 4.6k.
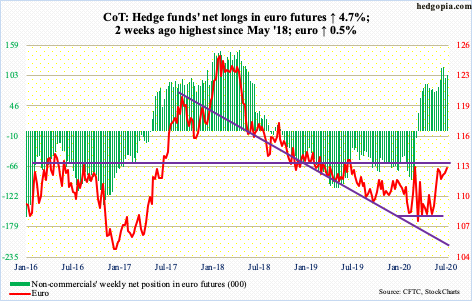
Before Monday’s breakout, the euro ($113) remained trapped within a flag/pennant for four to five weeks. Last week, bulls had defended $111.70s-80s. But they have been unable to build on Monday’s action. Bears continue to show up at $113.50s, which currently approximate the daily upper Bollinger band. The lower band lies at $111.81 – right at the aforementioned support. This likely gets tested near term.
Gold: Currently net long 267.4k, up 688.
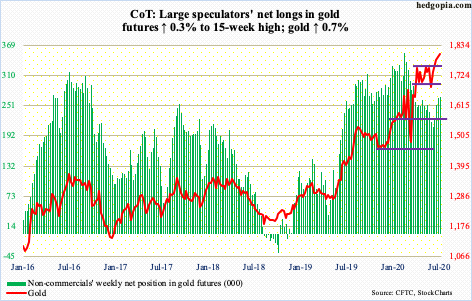
Gold-focused ETFs continue to take in funds, with GLD (SPDR Gold ETF) gaining $1.2 billion in the week to Wednesday and IAU (iShares Gold Trust) $211 million (courtesy of ETF.com). These ETFs have persistently attracted funds for a while now, with GLD taking in $3.7 billion and IAU $643 million in just the past three weeks.
Three weeks ago, after hammering on it for 11 straight weeks, gold ($1,801.90/ounce) broke out of $1,750s. Wednesday, it touched $1,829.80 intraday. Its all-time high of $1,923.70 was reached in September 2011.
The metal has had quite a rally the past four months. On March 16th, it bottomed at $1,450.90, as equities were selling hard. The latter bottomed a week later and then rallied hard. Gold has rallied with it. It is hard to determine if investors are risk-on or risk-off.
After the breakout three weeks ago, gold rallied all along its rising daily upper Bollinger band, concurrently finding support at the 10-day, including Friday. The daily remains way extended. In the event of a pullback, breakout retest is key.
Nasdaq 100 index (mini): Currently net long 44.7k, up 881.
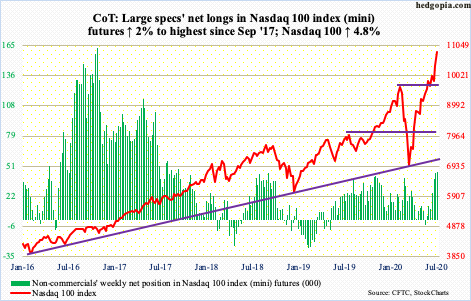
Nine sessions ago, the Nasdaq 100 (10836.33) dropped to 9742.89 intraday to test the February high. Bulls used that as an opportunity to go long. Through Friday’s new record high 10842.78, the index already rallied north of 11 percent. In nine sessions! Talk about going parabolic.
Money is coming in. In the week to Wednesday, QQQ (Invesco QQQ Trust) gained $3.6 billion (courtesy of ETF.com). Non-commercials have been adding, with net longs highest since September 2017. Momentum and breakout traders are piling in.
Amidst all this, subtle signs of distribution are appearing, with Tuesday forming a shooting star and Thursday a hanging man. That said, momentum is intact. The weekly produced a green marubozu. The 10-day does not get tested until 10397.42.
Russell 2000 mini-index: Currently net long 7.5k, down 12.2k.
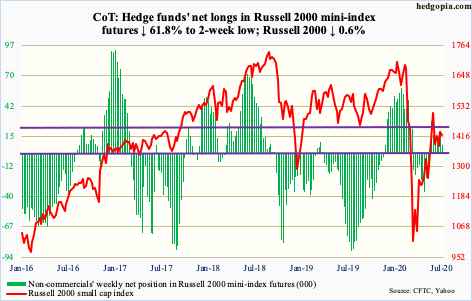
Several times since late May, rally attempts have been met by selling at/around 1450s. That was the case last Thursday as well as this Monday. Tuesday, the Russell 2000 (1422.68) slightly breached the lower bound of an ascending channel going back to March, with sellers showing up Thursday at the underside of that broken support.
Mid-June, bulls defended horizontal support at 1330s, which, as things stand, may act like a magnet for now.
US Dollar Index: Currently net short 4.9k, down 36.
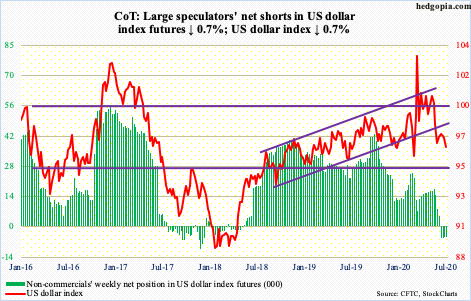
The US dollar index dropped from 103.96 on March 23rd to 95.70 on June 10th. Since that low, rally attempts were consistently sold off at 97.50s. Nearest support lies at 96.30s, which was undercut intraday Thursday but saved by close. A breach exposes the index (96.59) to a test of the June 10th low.
VIX: Currently net short 78.5k, up 7k.
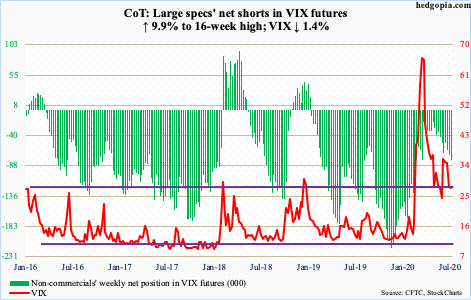
In three out of the last six sessions, the 200-day was tested – successfully. This includes Thursday’s low of 26.11 in a spinning top session. Support is decent at mid- to high-20s.
The 50-day (30.70) is no longer dropping. It is flat and is resisting rally attempts, including Friday. Thursday’s high of 31.48 was also denied at a falling trend line from March 18th when VIX printed 85.47. Once the index (27.29) rallies past this trend line and the 50-day, the next area to watch is 36-37. Volatility bulls will have significantly raised their odds once this level falls. Until then, the 200-day is a hair’s breadth away at 26.34.


