
COT Bonds Speculators Reduced Their 2-Year & 5-Year Bonds Bearish Bets This Week

Image Source: Pixabay
Here are the latest charts and statistics for the Commitment of Traders (COT) reports data published by the Commodities Futures Trading Commission (CFTC). The latest COT data is updated through Tuesday, Jan. 10, and it shows a quick view of how large traders (for-profit speculators and commercial hedgers) were positioned in the futures markets.
Weekly Speculator Changes Led by 2-Year Bonds & 5-Year Bonds
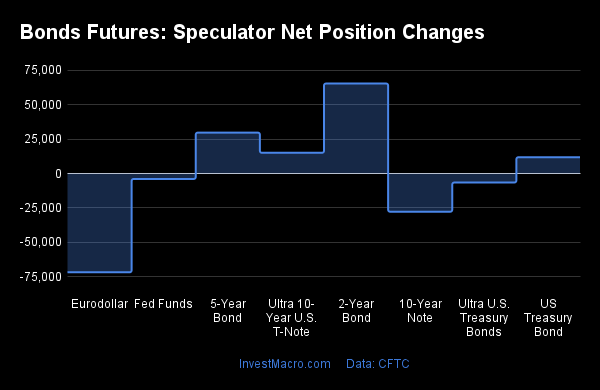
The COT bond market speculator bets were even this week, as four out of the eight bond markets we cover had higher positioning while the other four markets had lower speculator contracts. Leading the gains for the bond markets were the 2-year bonds (65,457 contracts), with the 5-year bonds (29,768 contracts), ultra 10-year bonds (15,087 contracts), and the US Treasury bonds (11,873 contracts) also experiencing a positive week.
The bond markets with declines in speculator bets for the week were the Eurodollar (-71,774 contracts), the 10-year bonds (-27,756 contracts), the ultra Treasury bonds (-6,512 contracts), and the Fed Funds (-3,929 contracts), as they all recorded lower bets on the week.
Highlighting the COT bonds data is the highly bearish speculator positioning seen in the 2-year and 5-year bonds.
The 2-year bond large speculator positions trimmed their bearish bets for a second straight week and for the sixth time in the past eight weeks. This improvement comes after speculators pushed their positioning to an all-time bearish low of -586,270 contracts on Nov. 15. Since that record low, speculators have taken off a total of 130,219 contracts from the bearish standing.
The 5-year bond speculator positions have also improved recently, with four straight weeks of decreasing bearish levels. The 5-year speculator positions had recently fallen to 216-week low of -691,537 contracts on Dec. 13, which marked the most bearish level since October of 2023. Since then, bets have gained by +68,386 contracts in the past four weeks.
Despite the recent improvements, both the 2-year and 5-year speculator levels continued to remain strongly bearish in this rising rate economic environment that also currently has yield curve inversions all over the total US bonds yield curve.
However, there is the potential that both significant lows (in the 2-year and 5-year) could be seen as bearish sentiment peaks if inflation data continues to moderate and the US Federal Reserve decides to scale back on their interest rate hikes.
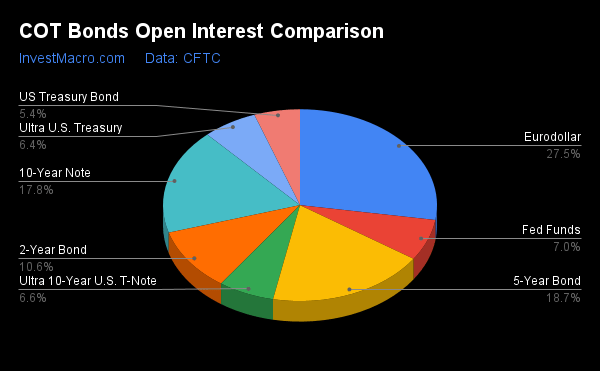
Data Snapshot of Bond Market Traders | Columns Legend
|
Jan-10-2023
|
OI
|
OI-Index
|
Spec-Net
|
Spec-Index
|
Com-Net
|
COM-Index
|
Smalls-Net
|
Smalls-Index
|
|---|---|---|---|---|---|---|---|---|
| Eurodollar | 6,013,989 | 1 | -1,055,535 | 34 | 1,258,804 | 64 | -203,269 | 60 |
| 5-Year | 4,095,328 | 57 | -623,151 | 9 | 657,644 | 87 | -34,493 | 72 |
| 10-Year | 3,894,938 | 57 | -411,358 | 10 | 488,454 | 80 | -77,096 | 62 |
| 2-Year | 2,319,897 | 25 | -456,051 | 19 | 452,472 | 79 | 3,579 | 54 |
| FedFunds | 1,527,145 | 49 | -112,330 | 26 | 129,044 | 76 | -16,714 | 19 |
| Long T-Bond | 1,184,966 | 40 | -157,385 | 33 | 129,734 | 57 | 27,651 | 75 |
Strength Scores Led by Eurodollar & Ultra Treasury Bonds
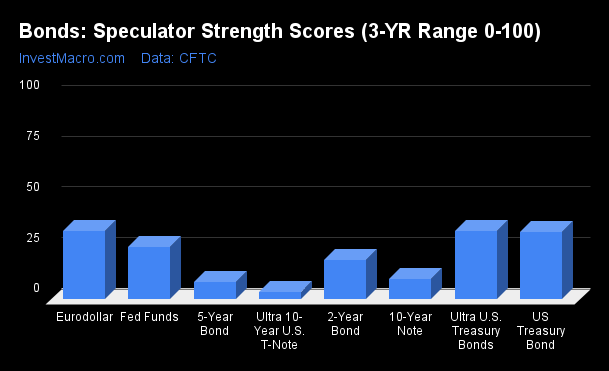
COT strength scores (a normalized measure of speculator positions over a three-year range, from 0 to 100 where above 80 is Extreme-Bullish and below 20 is Extreme-Bearish) showed that the Eurodollar (34%) and the ultra Treasury bonds (34%) led the bond markets this week. The US Treasury bonds (33%) came in as the next highest in terms of strength scores.
On the downside, the ultra 10-Year bonds (4%), the 5-year bonds (9%), the 10-year bonds (10%), and the 2-year bonds (19%) followed behind as the lowest in terms of strength scores, and they are all in Extreme-Bearish territory (below 20%).
Strength statistics:
- Fed Funds (25.8%) vs. Fed Funds the previous week (26.2%).
- 2-year bond (19.3%) vs. 2-year bond the previous week (9.6%).
- 5-year bond (8.7%) vs. 5-year bond the previous week (4.9%).
- 10-year bond (9.9%) vs. 10-year bond the previous week (14.1%).
- Ultra 10-year bond (3.9%) vs. ultra 10-year bond the previous week (0.0%).
- US Treasury bond (33.4%) vs. US Treasury bond the previous week (29.5%).
- Ultra US Treasury bond (33.7%) vs. ultra US Treasury bond the previous week (36.3%).
- Eurodollar (33.7%) vs. Eurodollar the previous week (35.0%).
Eurodollar & 2-Year Bonds Top the Six-Week Strength Trends
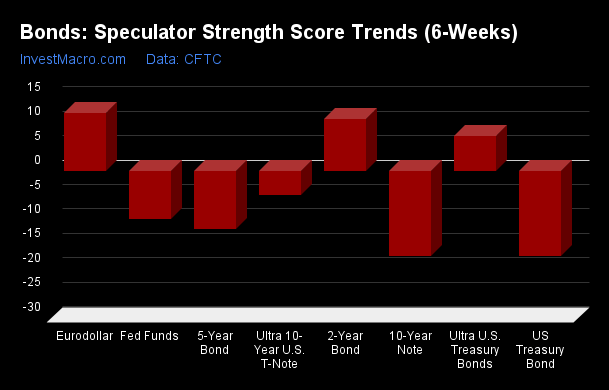
COT strength score trends (or otherwise called the move index, which calculates the six-week changes in strength scores) showed that the Eurodollar (12%) and the 2-year bonds (11%) led the trends for bonds over the past six weeks. The ultra Treasury bonds (7%) followed as the next highest positive mover in terms of trends.
The 10-year bonds (-17%) and the US Treasury bonds (-17%) led the downside trends, with the 5-year bonds (-12%) following behind.
Strength trend statistics:
- Fed Funds (-9.8%) vs. Fed Funds the previous week (-14.8%).
- 2-year bond (10.7%) vs. 2-year bond the previous week (6.7%).
- 5-year bond (-11.9%) vs. 5-year bond the previous week (-16.4%).
- 10-year bond (-17.4%) vs. 10-year bond the previous week (-9.5%).
- Ultra 10-year bond (-4.9%) vs. ultra 10-year bond the previous week (-2.1%).
- US Treasury bond (-17.4%) vs. US Treasury bond the previous week (-25.6%).
- Ultra US Treasury bond (7.3%) vs. ultra US Treasury bond the previous week (4.9%).
- Eurodollar (12.0%) vs. Eurodollar the previous week (15.5%).
Individual Bond Markets - 3-Month Eurodollars Futures
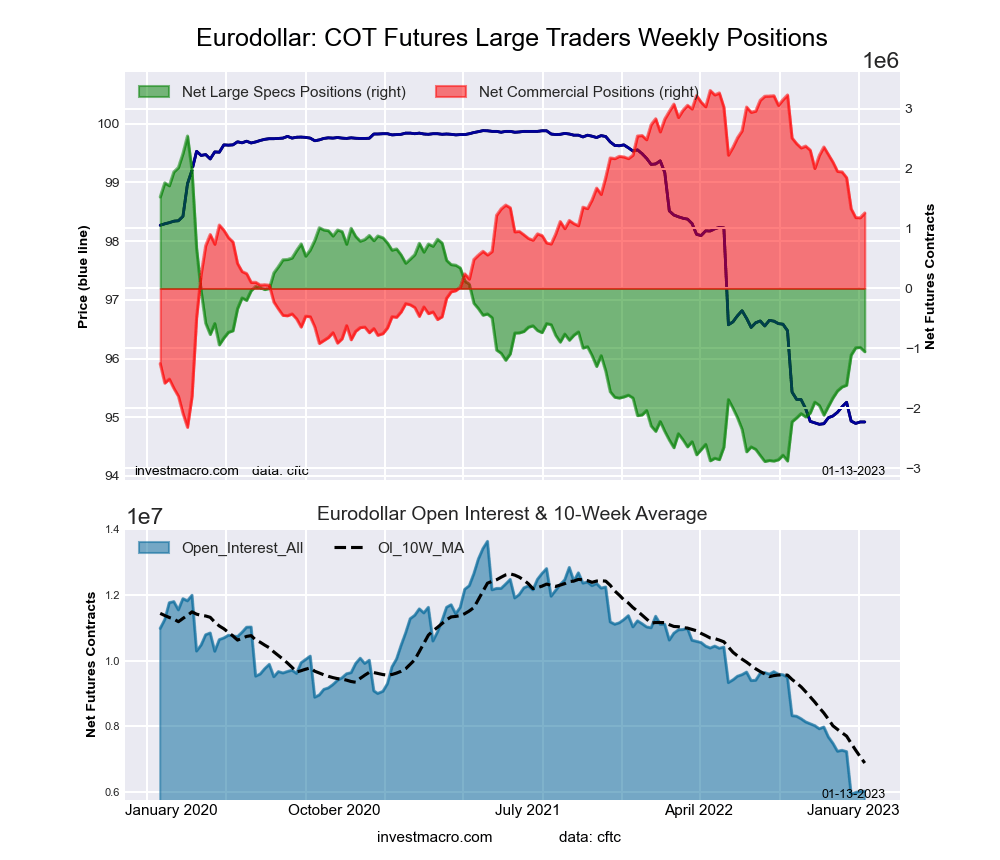
The 3-month Eurodollars large speculator standing this week recorded a net position of -1,055,535 contracts in the data reported through Tuesday. This was a weekly lowering of -71,774 contracts from the previous week, which had a total of -983,761 net contracts.
This week’s current strength score (the trader positioning range over the past three years, measured from 0 to 100) shows the speculators are currently Bearish with a score of 33.7%. The commercials are Bullish with a score of 63.6%, and the small traders (not shown in chart) are Bullish with a score of 59.7%.
| 3-Month Eurodollars Statistics | SPECULATORS | COMMERCIALS | SMALL TRADERS |
| –% of Open Interest Longs: | 7.5 | 69.9 | 5.1 |
| –% of Open Interest Shorts: | 25.0 | 48.9 | 8.5 |
| – Net Position: | -1,055,535 | 1,258,804 | -203,269 |
| – Gross Longs: | 450,880 | 4,201,292 | 306,594 |
| – Gross Shorts: | 1,506,415 | 2,942,488 | 509,863 |
| – Long to Short Ratio: | 0.3 to 1 | 1.4 to 1 | 0.6 to 1 |
| NET POSITION TREND: | |||
| – Strength Index Score (3 Year Range Pct): | 33.7 | 63.6 | 59.7 |
| – Strength Index Reading (3 Year Range): | Bearish | Bullish | Bullish |
| NET POSITION MOVEMENT INDEX: | |||
| – 6-Week Change in Strength Index: | 12.0 | -12.3 | 8.7 |
30-Day Federal Funds Futures
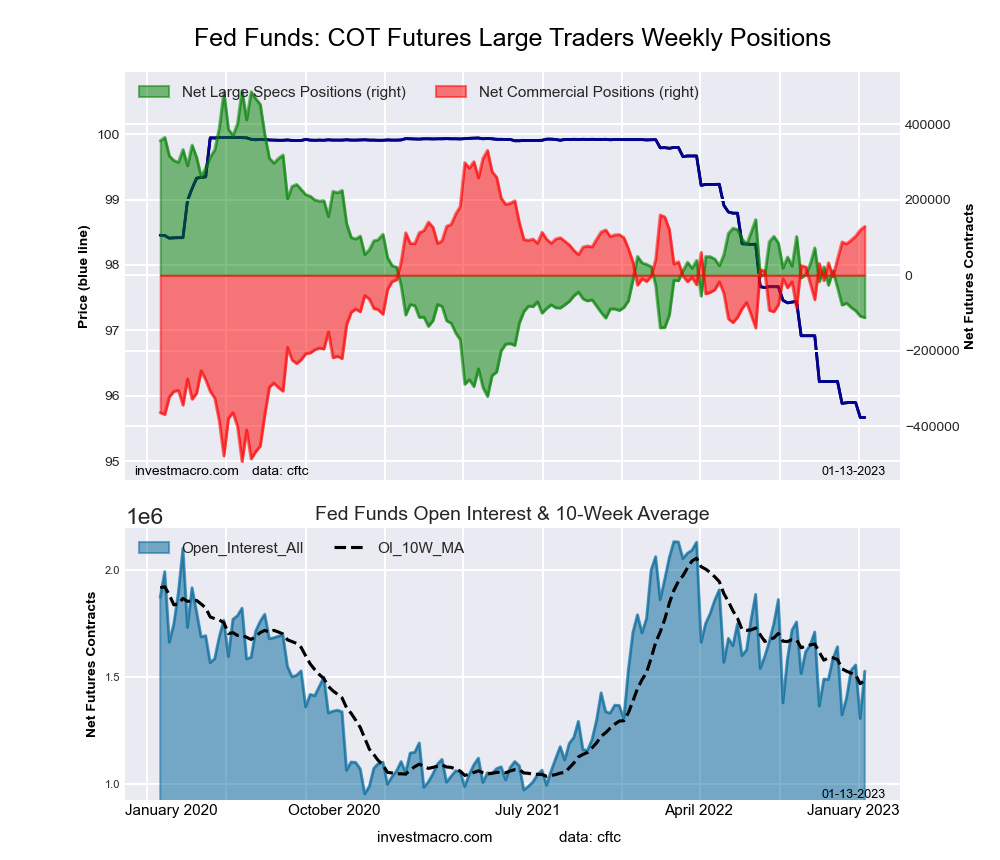
The 30-day Federal Funds large speculator standing this week recorded a net position of -112,330 contracts in the data reported through Tuesday. This was a weekly decrease of -3,929 contracts from the previous week, which had a total of -108,401 net contracts.
This week’s current strength score (the trader positioning range over the past three years, measured from 0 to 100) shows the speculators are currently Bearish with a score of 25.8%. The commercials are Bullish with a score of 75.5%, and the small traders (not shown in chart) are Bearish-Extreme with a score of 19.4%.
| 30-Day Federal Funds Statistics | SPECULATORS | COMMERCIALS | SMALL TRADERS |
| –% of Open Interest Longs: | 8.7 | 76.8 | 2.0 |
| –% of Open Interest Shorts: | 16.0 | 68.3 | 3.1 |
| – Net Position: | -112,330 | 129,044 | -16,714 |
| – Gross Longs: | 132,184 | 1,172,814 | 31,131 |
| – Gross Shorts: | 244,514 | 1,043,770 | 47,845 |
| – Long to Short Ratio: | 0.5 to 1 | 1.1 to 1 | 0.7 to 1 |
| NET POSITION TREND: | |||
| – Strength Index Score (3 Year Range Pct): | 25.8 | 75.5 | 19.4 |
| – Strength Index Reading (3 Year Range): | Bearish | Bullish | Bearish-Extreme |
| NET POSITION MOVEMENT INDEX: | |||
| – 6-Week Change in Strength Index: | -9.8 | 10.4 | -18.4 |
2-Year Treasury Note Futures
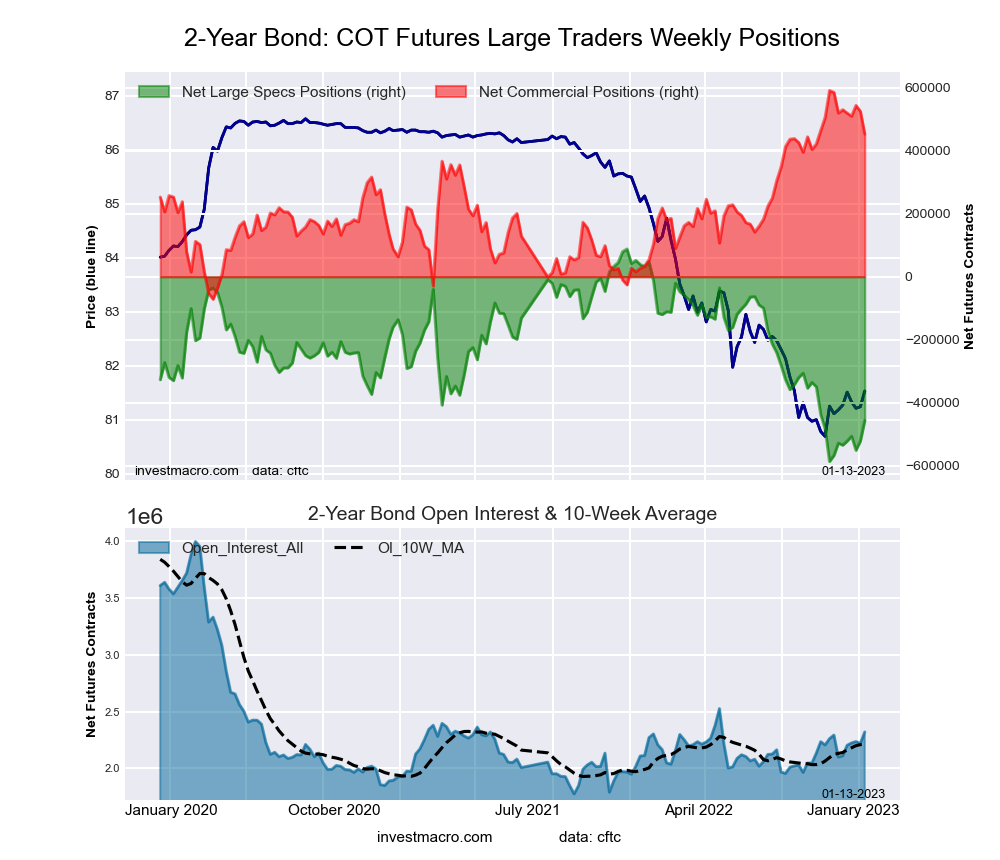
The 2-year Treasury note large speculator standing this week recorded a net position of -456,051 contracts in the data reported through Tuesday. This was a weekly boost of 65,457 contracts from the previous week, which had a total of -521,508 net contracts.
This week’s current strength score (the trader positioning range over the past three years, measured from 0 to 100) shows the speculators are currently Bearish-Extreme with a score of 19.3%. The commercials are Bullish with a score of 79.1%, and the small traders (not shown in chart) are Bullish with a score of 53.6%.
| 2-Year Treasury Note Statistics | SPECULATORS | COMMERCIALS | SMALL TRADERS |
| –% of Open Interest Longs: | 9.5 | 80.1 | 8.6 |
| –% of Open Interest Shorts: | 29.2 | 60.6 | 8.4 |
| – Net Position: | -456,051 | 452,472 | 3,579 |
| – Gross Longs: | 220,701 | 1,857,300 | 199,092 |
| – Gross Shorts: | 676,752 | 1,404,828 | 195,513 |
| – Long to Short Ratio: | 0.3 to 1 | 1.3 to 1 | 1.0 to 1 |
| NET POSITION TREND: | |||
| – Strength Index Score (3 Year Range Pct): | 19.3 | 79.1 | 53.6 |
| – Strength Index Reading (3 Year Range): | Bearish-Extreme | Bullish | Bullish |
| NET POSITION MOVEMENT INDEX: | |||
| – 6-Week Change in Strength Index: | 10.7 | -10.1 | -2.3 |
5-Year Treasury Note Futures
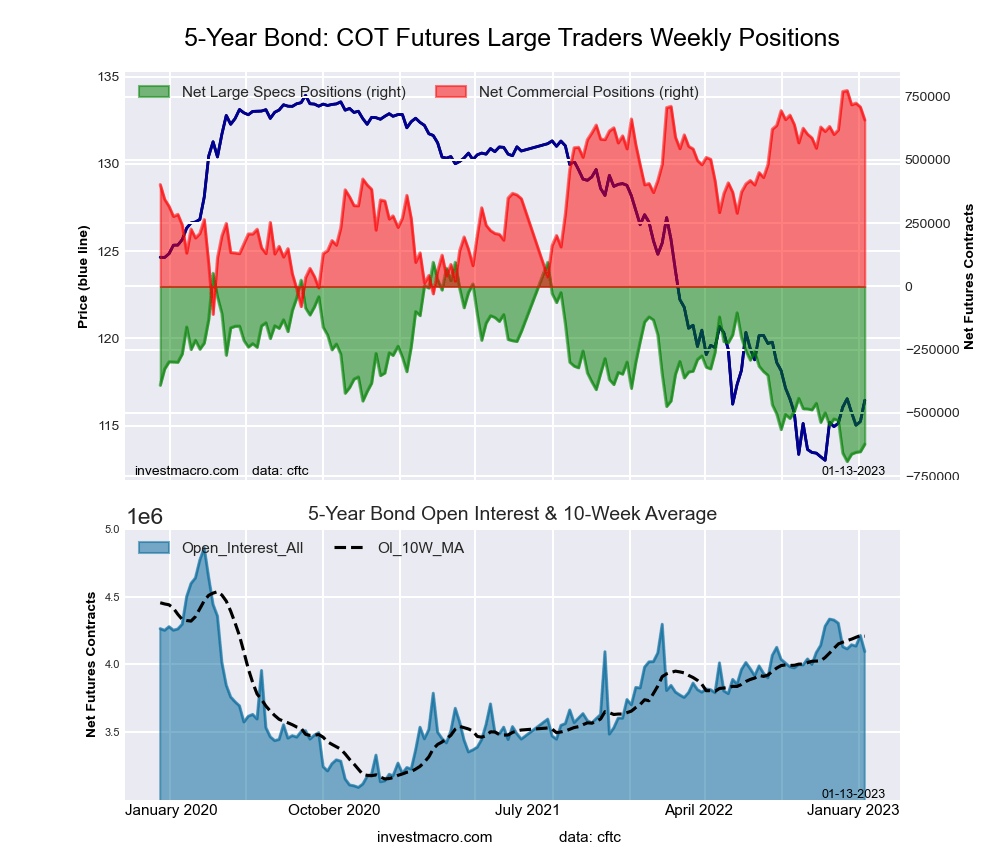
The 5-year Treasury note large speculator standing this week recorded a net position of -623,151 contracts in the data reported through Tuesday. This was a weekly gain of 29,768 contracts from the previous week, which had a total of -652,919 net contracts.
This week’s current strength score (the trader positioning range over the past three years, measured from 0 to 100) shows the speculators are currently Bearish-Extreme with a score of 8.7%. The commercials are Bullish-Extreme with a score of 86.8%, and the small traders (not shown in chart) are Bullish with a score of 71.6%.
| 5-Year Treasury Note Statistics | SPECULATORS | COMMERCIALS | SMALL TRADERS |
| –% of Open Interest Longs: | 5.8 | 84.8 | 8.0 |
| –% of Open Interest Shorts: | 21.0 | 68.7 | 8.8 |
| – Net Position: | -623,151 | 657,644 | -34,493 |
| – Gross Longs: | 235,968 | 3,471,933 | 326,120 |
| – Gross Shorts: | 859,119 | 2,814,289 | 360,613 |
| – Long to Short Ratio: | 0.3 to 1 | 1.2 to 1 | 0.9 to 1 |
| NET POSITION TREND: | |||
| – Strength Index Score (3 Year Range Pct): | 8.7 | 86.8 | 71.6 |
| – Strength Index Reading (3 Year Range): | Bearish-Extreme | Bullish-Extreme | Bullish |
| NET POSITION MOVEMENT INDEX: | |||
| – 6-Week Change in Strength Index: | -11.9 | 4.4 | 15.0 |
10-Year Treasury Note Futures
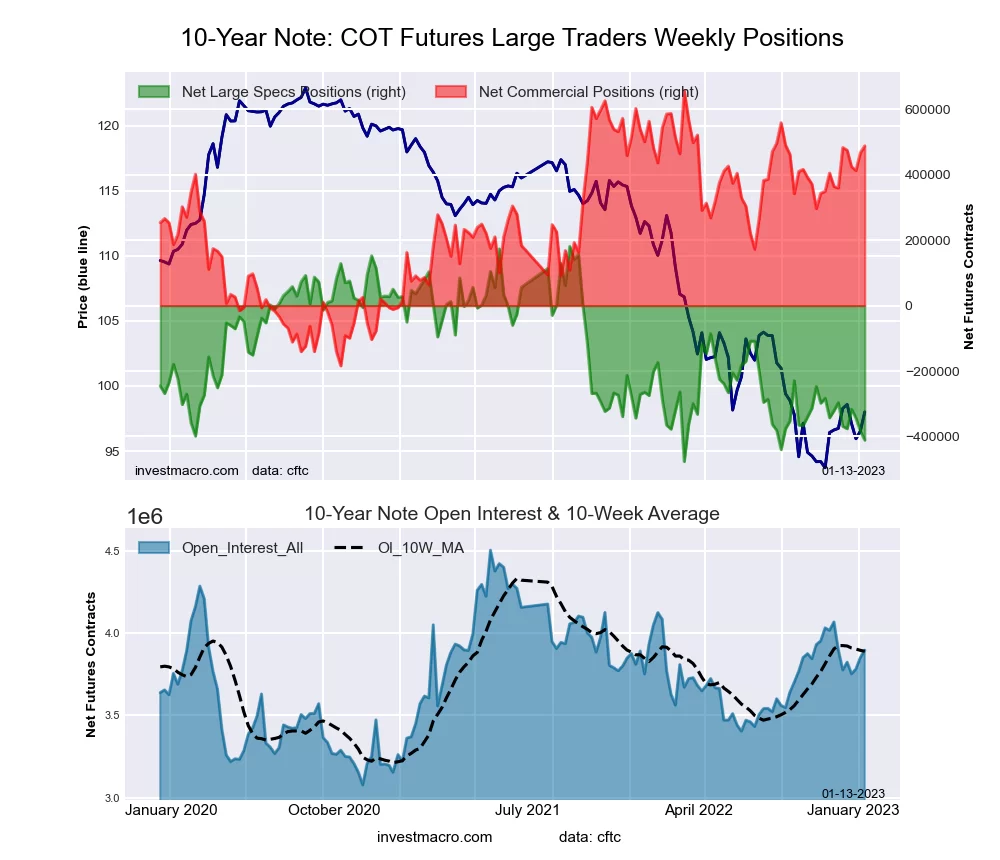
The 10-year Treasury note large speculator standing this week recorded a net position of -411,358 contracts in the data reported through Tuesday. This was a weekly lowering of -27,756 contracts from the previous week, which had a total of -383,602 net contracts.
This week’s current strength score (the trader positioning range over the past three years, measured from 0 to 100) shows the speculators are currently Bearish-Extreme with a score of 9.9%. The commercials are Bullish with a score of 79.9%, and the small traders (not shown in chart) are Bullish with a score of 61.8%.
| 10-Year Treasury Note Statistics | SPECULATORS | COMMERCIALS | SMALL TRADERS |
| –% of Open Interest Longs: | 9.1 | 79.5 | 9.0 |
| –% of Open Interest Shorts: | 19.7 | 66.9 | 11.0 |
| – Net Position: | -411,358 | 488,454 | -77,096 |
| – Gross Longs: | 355,989 | 3,095,025 | 350,630 |
| – Gross Shorts: | 767,347 | 2,606,571 | 427,726 |
| – Long to Short Ratio: | 0.5 to 1 | 1.2 to 1 | 0.8 to 1 |
| NET POSITION TREND: | |||
| – Strength Index Score (3 Year Range Pct): | 9.9 | 79.9 | 61.8 |
| – Strength Index Reading (3 Year Range): | Bearish-Extreme | Bullish | Bullish |
| NET POSITION MOVEMENT INDEX: | |||
| – 6-Week Change in Strength Index: | -17.4 | 15.3 | -3.4 |
Ultra 10-Year Notes Futures
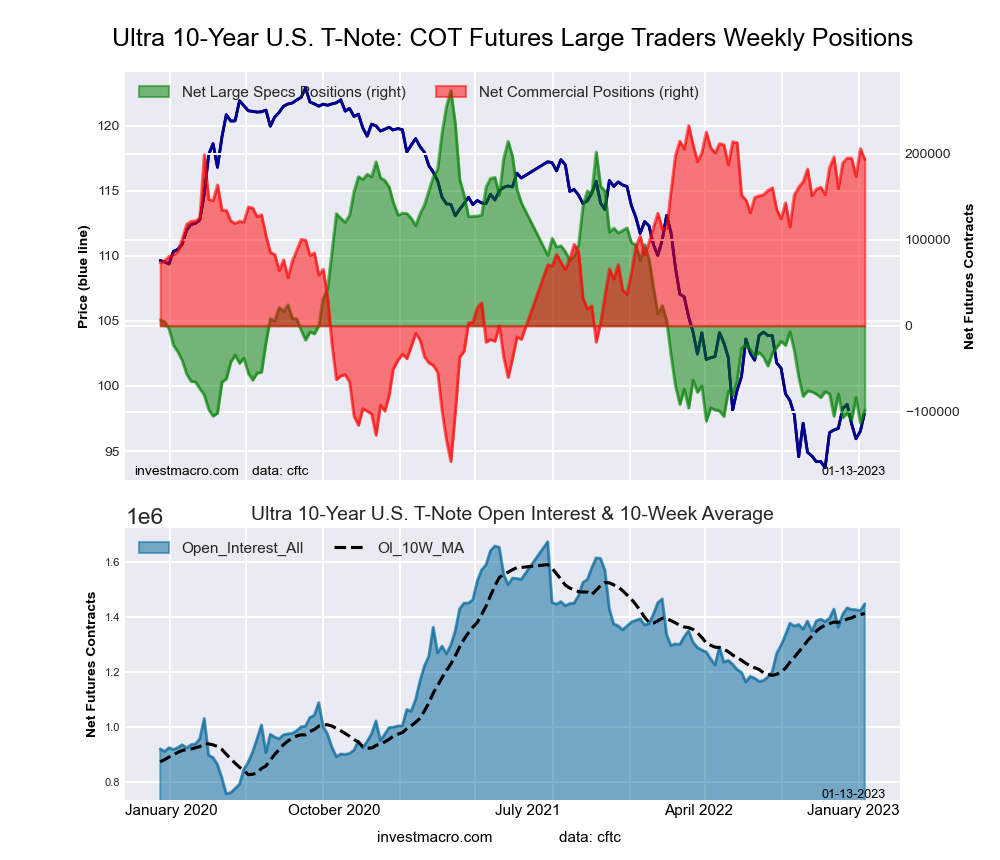
The ultra 10-year notes large speculator standing this week recorded a net position of -98,270 contracts in the data reported through Tuesday. This was a weekly lift of 15,087 contracts from the previous week, which had a total of -113,357 net contracts.
This week’s current strength score (the trader positioning range over the past three years, measured from 0 to 100) shows the speculators are currently Bearish-Extreme with a score of 3.9%. The commercials are Bullish-Extreme with a score of 89.9%, and the small traders (not shown in chart) are Bullish with a score of 63.9%.
| Ultra 10-Year Notes Statistics | SPECULATORS | COMMERCIALS | SMALL TRADERS |
| –% of Open Interest Longs: | 10.6 | 78.6 | 9.9 |
| –% of Open Interest Shorts: | 17.4 | 65.3 | 16.4 |
| – Net Position: | -98,270 | 193,388 | -95,118 |
| – Gross Longs: | 153,296 | 1,138,679 | 142,921 |
| – Gross Shorts: | 251,566 | 945,291 | 238,039 |
| – Long to Short Ratio: | 0.6 to 1 | 1.2 to 1 | 0.6 to 1 |
| NET POSITION TREND: | |||
| – Strength Index Score (3 Year Range Pct): | 3.9 | 89.9 | 63.9 |
| – Strength Index Reading (3 Year Range): | Bearish-Extreme | Bullish-Extreme | Bullish |
| NET POSITION MOVEMENT INDEX: | |||
| – 6-Week Change in Strength Index: | -4.9 | 8.7 | -9.8 |
US Treasury Bonds Futures
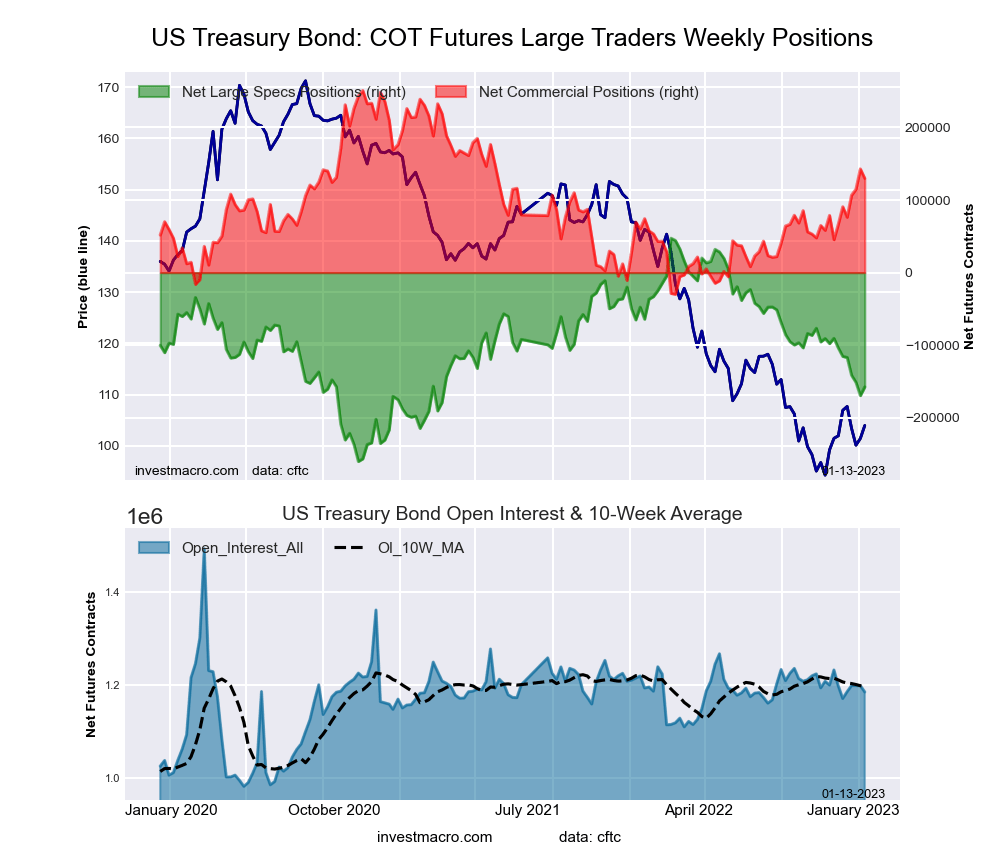
The US Treasury bonds large speculator standing this week recorded a net position of -157,385 contracts in the data reported through Tuesday. This was a weekly advance of 11,873 contracts from the previous week, which had a total of -169,258 net contracts.
This week’s current strength score (the trader positioning range over the past three years, measured from 0 to 100) shows the speculators are currently Bearish with a score of 33.4%. The commercials are Bullish with a score of 56.9%, and the small traders (not shown in chart) are Bullish with a score of 74.5%.
| US Treasury Bonds Statistics | SPECULATORS | COMMERCIALS | SMALL TRADERS |
| –% of Open Interest Longs: | 5.7 | 79.0 | 14.6 |
| –% of Open Interest Shorts: | 18.9 | 68.0 | 12.3 |
| – Net Position: | -157,385 | 129,734 | 27,651 |
| – Gross Longs: | 66,962 | 935,742 | 173,392 |
| – Gross Shorts: | 224,347 | 806,008 | 145,741 |
| – Long to Short Ratio: | 0.3 to 1 | 1.2 to 1 | 1.2 to 1 |
| NET POSITION TREND: | |||
| – Strength Index Score (3 Year Range Pct): | 33.4 | 56.9 | 74.5 |
| – Strength Index Reading (3 Year Range): | Bearish | Bullish | Bullish |
| NET POSITION MOVEMENT INDEX: | |||
| – 6-Week Change in Strength Index: | -17.4 | 22.4 | -7.5 |
Ultra US Treasury Bonds Futures
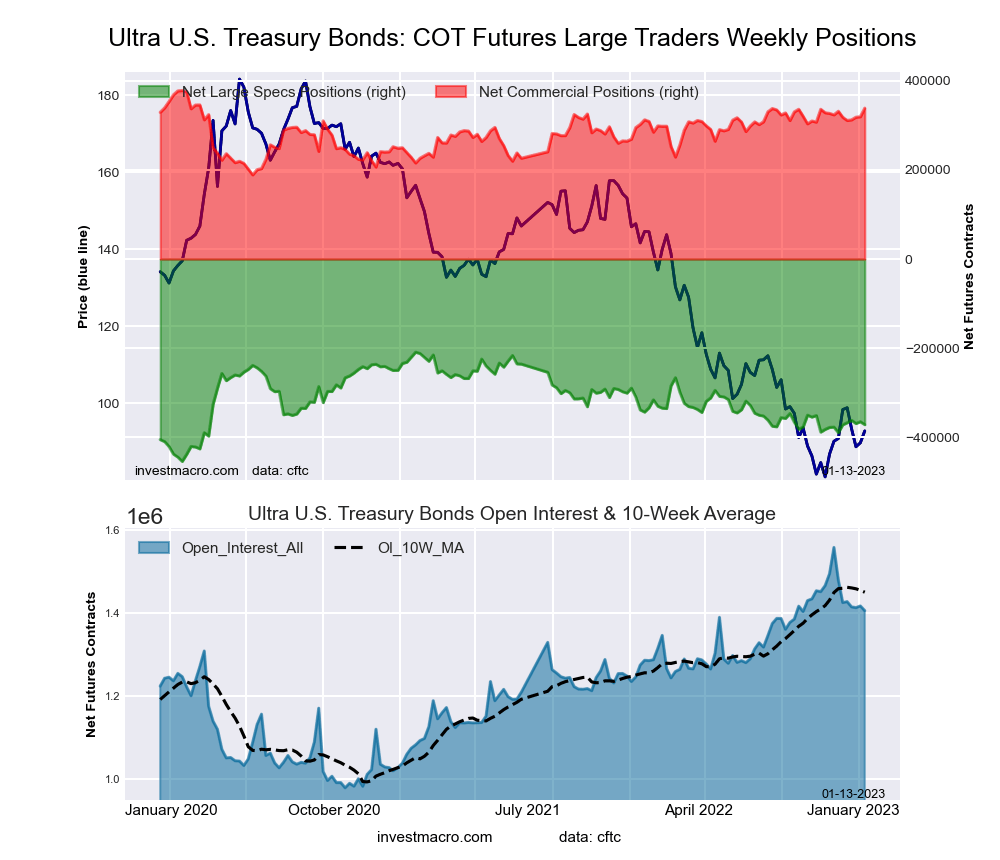
The ultra US Treasury bonds large speculator standing this week recorded a net position of -371,406 contracts in the data reported through Tuesday. This was a weekly reduction of -6,512 contracts from the previous week, which had a total of -364,894 net contracts.
This week’s current strength score (the trader positioning range over the past three years, measured from 0 to 100) shows the speculators are currently Bearish with a score of 33.7%. The commercials are Bullish with a score of 79.1%, and the small traders (not shown in chart) are Bullish with a score of 59.0%.
| Ultra US Treasury Bonds Statistics | SPECULATORS | COMMERCIALS | SMALL TRADERS |
| –% of Open Interest Longs: | 4.5 | 83.7 | 11.5 |
| –% of Open Interest Shorts: | 31.0 | 59.6 | 9.1 |
| – Net Position: | -371,406 | 338,409 | 32,997 |
| – Gross Longs: | 63,917 | 1,176,415 | 161,277 |
| – Gross Shorts: | 435,323 | 838,006 | 128,280 |
| – Long to Short Ratio: | 0.1 to 1 | 1.4 to 1 | 1.3 to 1 |
| NET POSITION TREND: | |||
| – Strength Index Score (3 Year Range Pct): | 33.7 | 79.1 | 59.0 |
| – Strength Index Reading (3 Year Range): | Bearish | Bullish | Bullish |
| NET POSITION MOVEMENT INDEX: | |||
| – 6-Week Change in Strength Index: | 7.3 | 3.7 | -20.4 |
Article By InvestMacro – Receive our weekly COT Newsletter
*COT Report: The COT data, released weekly to the public each Friday, is updated through the most recent Tuesday (data is three days old) and shows a quick view of how large speculators or non-commercials (for-profit traders) were positioned in the futures markets.
The CFTC categorizes trader positions according to commercial hedgers (traders who use futures contracts for hedging as part of the business), non-commercials (large traders who speculate to realize trading profits), and non-reportable traders (usually small traders/speculators) as well as their open interest (contracts open in the market at time of reporting). See CFTC criteria here.
More By This Author:
Speculator Extremes: Soybean Meal & Ultra 10-Year Bonds Lead Weekly Bullish & Bearish Positions
Large Currency Speculators Trimmed Euro Bullish Bets
Metals Speculators Push Their Platinum Bullish Bets To 91-Week High
Disclosure: Foreign Currency trading and trading on margin carries a high level of risk and can result in loss of part or all of your investment.Due to the level of risk and market volatility, ...
more

