
COT Bonds Speculators Cut Back On Eurodollar Bearish Bets For 10th Time In 11 Weeks

Here are the latest charts and statistics for the Commitment of Traders (COT) reports data published by the Commodities Futures Trading Commission (CFTC).
The latest COT data is updated through Tuesday January 24th and shows a quick view of how large traders (for-profit speculators and commercial hedgers) were positioned in the futures markets.
Weekly Speculator Changes led by Fed Funds & 5-Year Bonds
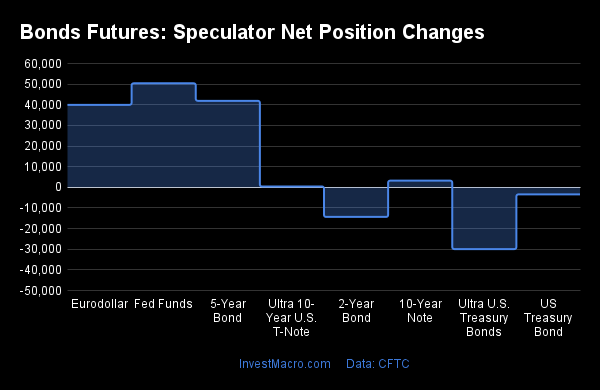
The COT bond market speculator bets were higher this week as five out of the eight bond markets we cover had higher positioning while the other three markets had lower speculator contracts.
The bond markets with declines in speculator bets for the week were the Ultra Treasury Bonds (-29,935 contracts), the US Treasury Bonds (-3,423 contracts) and the 2-Year Bonds (-14,352 contracts) also registering lower bets on the week.
Highlighting the COT bond’s data this week is the continued improvement of the speculator positioning in the Eurodollar. Large speculative positions for the Eurodollar rose this week by almost +40,000 contracts and have now improved (or become less bearish) in ten out of the past eleven weeks. This recent improvement has taken +1,098,777 contracts off of the overall bearish position, going from a total bearish net position of -2,112,650 contracts on November 8th to this week’s total net position of -1,013,873 contracts (an improvement of approximately 50 percent).
Eurodollar futures contracts are one of the largest futures markets and are essentially a bet on short-term interest rates. As Eurodollar prices fall, the implied interest rises (and vice versa) and at this moment, the price of Eurodollar futures is approximately 95.00 for an implied interest rate of 5.00 percent.
The decrease in the bearish positioning of speculators suggests that traders are anticipating a possible peak has happened in the short-term interest rates. This is likely due to falling inflation and anticipation of the US Federal Reserve slowing their interest rate hikes.
|
Jan-24-2023
|
OI
|
OI-Index
|
Spec-Net
|
Spec-Index
|
Com-Net
|
COM-Index
|
Smalls-Net
|
Smalls-Index
|
|---|---|---|---|---|---|---|---|---|
| Eurodollar | 5,949,563 | 1 | -1,013,873 | 34 | 1,212,772 | 63 | -198,899 | 61 |
| 5-Year | 4,162,628 | 61 | -638,737 | 7 | 633,820 | 84 | 4,917 | 82 |
| 10-Year | 4,124,381 | 73 | -541,821 | 0 | 598,839 | 93 | -57,018 | 67 |
| 2-Year | 2,416,615 | 29 | -477,023 | 16 | 454,881 | 79 | 22,142 | 62 |
| FedFunds | 1,798,641 | 72 | -35,830 | 35 | 61,847 | 67 | -26,017 | 0 |
| Long T-Bond | 1,235,758 | 50 | -195,816 | 21 | 155,710 | 66 | 40,106 | 84 |
Strength Scores led by Fed Funds & Eurodollar
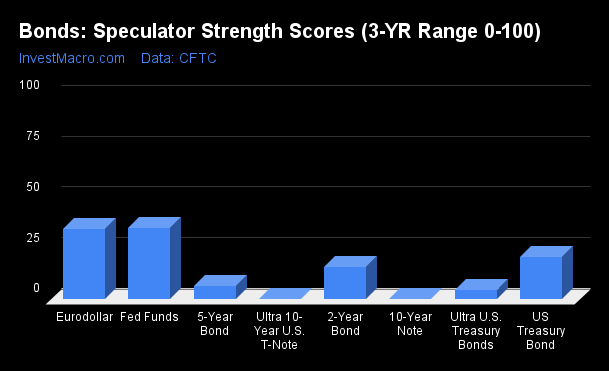
COT Strength Scores (a normalized measure of Speculator positions over a 3-Year range, from 0 to 100 where above 80 is Extreme-Bullish and below 20 is Extreme-Bearish) showed that the Fed Funds (35 percent) and the Eurodollar (34 percent) lead the bond markets this week. The US Treasury Bonds (21 percent) comes in as the next highest in the weekly strength scores.
On the downside, the Ultra 10-Year Bonds (0 percent), the 10-Year Bonds (0 percent), the Ultra Treasury Bonds (5 percent), the 5-Year Bond (6.7 percent) and the 2-Year Bond (16.2 percent) come in at the lowest strength levels currently and are all in Extreme-Bearish territory (below 20 percent).
Strength Statistics:
Fed Funds (35.2 percent) vs Fed Funds previous week (29.0 percent)
2-Year Bond (16.2 percent) vs 2-Year Bond previous week (18.3 percent)
5-Year Bond (6.7 percent) vs 5-Year Bond previous week (1.4 percent)
10-Year Bond (0.4 percent) vs 10-Year Bond previous week (0.0 percent)
Ultra 10-Year Bond (0.1 percent) vs Ultra 10-Year Bond previous week (0.0 percent)
US Treasury Bond (20.9 percent) vs US Treasury Bond previous week (22.0 percent)
Ultra US Treasury Bond (4.8 percent) vs Ultra US Treasury Bond previous week (18.6 percent)
Eurodollar (34.5 percent) vs Eurodollar previous week (33.8 percent)
Eurodollar & 2-Year Bonds top the 6-Week Strength Trends
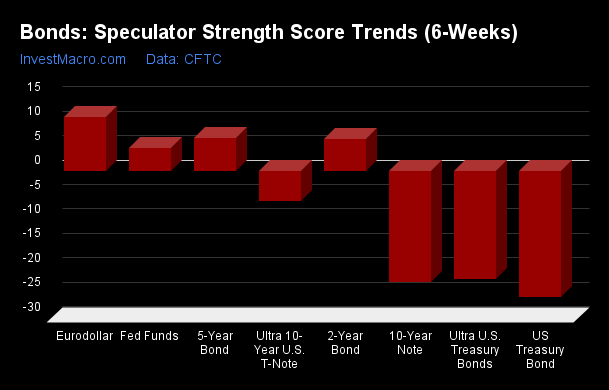
COT Strength Score Trends (or move index, calculates the 6-week changes in strength scores) showed that the Eurodollar (11 percent) and the 2-Year Bonds (7 percent) lead the past six weeks trends for bonds. The 5-Year Bonds (7 percent) is the next highest positive movers in the latest trends data.
The US Treasury Bonds (-26 percent) leads the downside trend scores currently with the 10-Year Bonds (-23 percent) and the Ultra Treasury Bonds (-22 percent) following next with lower trend scores.
Strength Trend Statistics:
Fed Funds (4.7 percent) vs Fed Funds previous week (-0.9 percent)
2-Year Bond (6.6 percent) vs 2-Year Bond previous week (10.7 percent)
5-Year Bond (6.7 percent) vs 5-Year Bond previous week (-2.8 percent)
10-Year Bond (-22.8 percent) vs 10-Year Bond previous week (-24.2 percent)
Ultra 10-Year Bond (-6.1 percent) vs Ultra 10-Year Bond previous week (-4.8 percent)
US Treasury Bond (-25.7 percent) vs US Treasury Bond previous week (-25.1 percent)
Ultra US Treasury Bond (-22.2 percent) vs Ultra US Treasury Bond previous week (-6.3 percent)
Eurodollar (11.1 percent) vs Eurodollar previous week (10.9 percent)
Individual Bond Markets:
3-Month Eurodollars Futures:
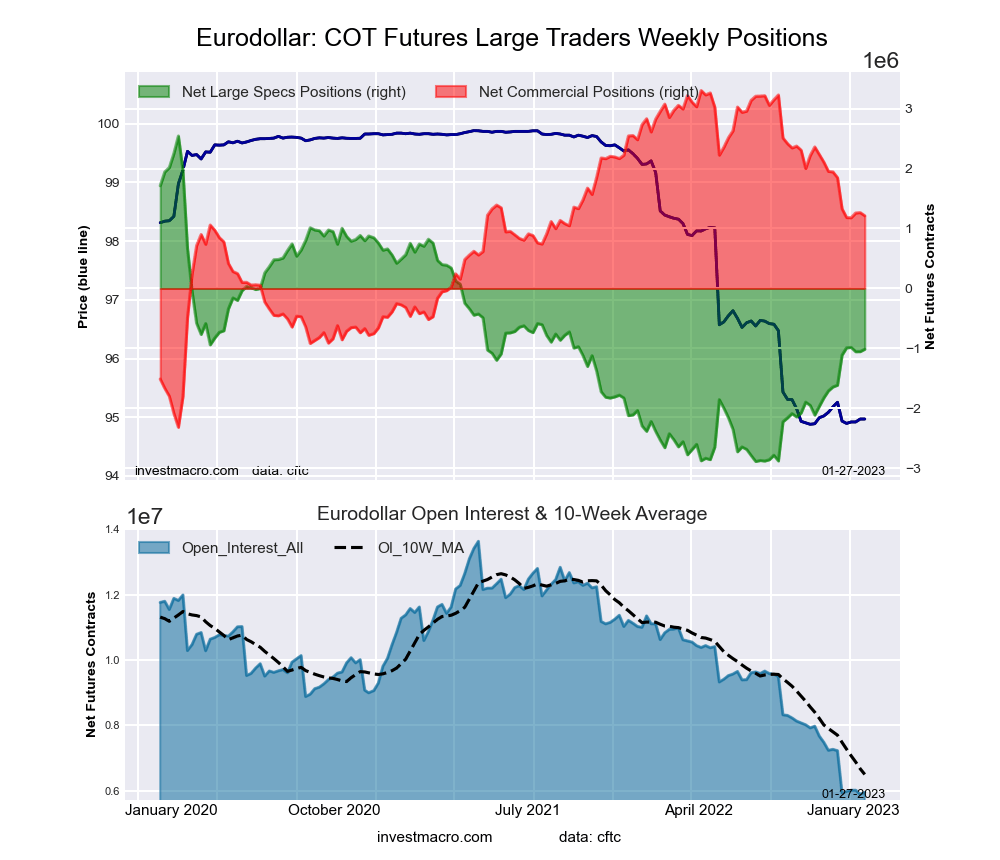
The 3-Month Eurodollars large speculator standing this week totaled a net position of -1,013,873 contracts in the data reported through Tuesday. This was a weekly boost of 39,979 contracts from the previous week which had a total of -1,053,852 net contracts.
This week’s current strength score (the trader positioning range over the past three years, measured from 0 to 100) shows the speculators are currently Bearish with a score of 34.5 percent. The commercials are Bullish with a score of 62.8 percent and the small traders (not shown in chart) are Bullish with a score of 60.7 percent.
| 3-Month Eurodollars Statistics | SPECULATORS | COMMERCIALS | SMALL TRADERS |
| – Percent of Open Interest Longs: | 8.8 | 68.5 | 5.0 |
| – Percent of Open Interest Shorts: | 25.8 | 48.1 | 8.3 |
| – Net Position: | -1,013,873 | 1,212,772 | -198,899 |
| – Gross Longs: | 522,881 | 4,073,591 | 295,903 |
| – Gross Shorts: | 1,536,754 | 2,860,819 | 494,802 |
| – Long to Short Ratio: | 0.3 to 1 | 1.4 to 1 | 0.6 to 1 |
| NET POSITION TREND: | |||
| – Strength Index Score (3 Year Range Pct): | 34.5 | 62.8 | 60.7 |
| – Strength Index Reading (3 Year Range): | Bearish | Bullish | Bullish |
| NET POSITION MOVEMENT INDEX: | |||
| – 6-Week Change in Strength Index: | 11.1 | -11.3 | 7.5 |
30-Day Federal Funds Futures:
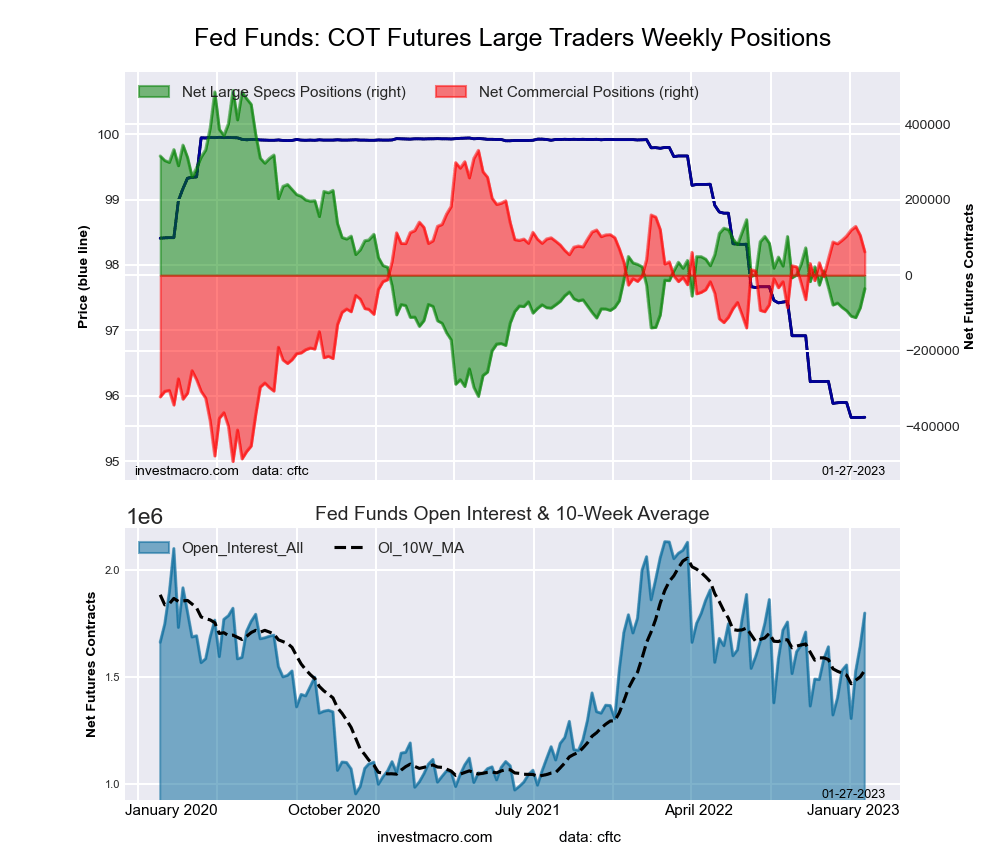
The 30-Day Federal Funds large speculator standing this week totaled a net position of -35,830 contracts in the data reported through Tuesday. This was a weekly advance of 50,405 contracts from the previous week which had a total of -86,235 net contracts.
This week’s current strength score (the trader positioning range over the past three years, measured from 0 to 100) shows the speculators are currently Bearish with a score of 35.2 percent. The commercials are Bullish with a score of 67.4 percent and the small traders (not shown in chart) are Bearish-Extreme with a score of 0.0 percent.
| 30-Day Federal Funds Statistics | SPECULATORS | COMMERCIALS | SMALL TRADERS |
| – Percent of Open Interest Longs: | 9.7 | 75.4 | 1.8 |
| – Percent of Open Interest Shorts: | 11.7 | 72.0 | 3.2 |
| – Net Position: | -35,830 | 61,847 | -26,017 |
| – Gross Longs: | 174,466 | 1,356,289 | 31,773 |
| – Gross Shorts: | 210,296 | 1,294,442 | 57,790 |
| – Long to Short Ratio: | 0.8 to 1 | 1.0 to 1 | 0.5 to 1 |
| NET POSITION TREND: | |||
| – Strength Index Score (3 Year Range Pct): | 35.2 | 67.4 | 0.0 |
| – Strength Index Reading (3 Year Range): | Bearish | Bullish | Bearish-Extreme |
| NET POSITION MOVEMENT INDEX: | |||
| – 6-Week Change in Strength Index: | 4.7 | -2.6 | -45.1 |
2-Year Treasury Note Futures:
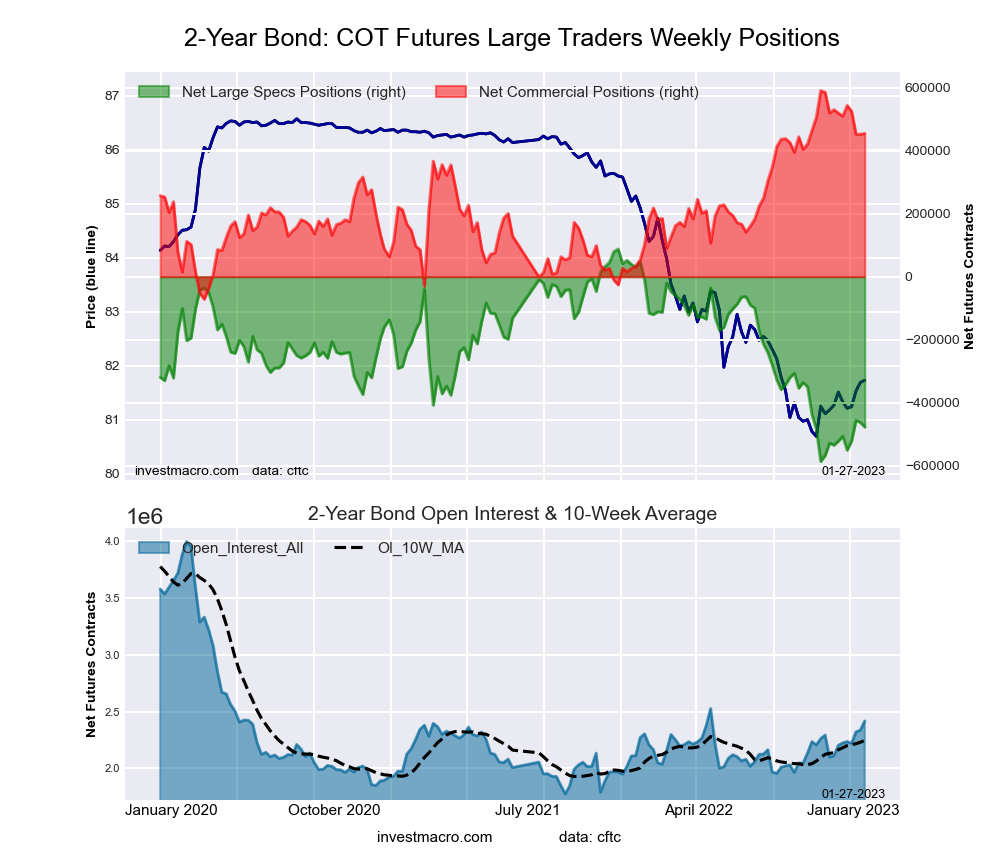
The 2-Year Treasury Note large speculator standing this week totaled a net position of -477,023 contracts in the data reported through Tuesday. This was a weekly lowering of -14,352 contracts from the previous week which had a total of -462,671 net contracts.
This week’s current strength score (the trader positioning range over the past three years, measured from 0 to 100) shows the speculators are currently Bearish-Extreme with a score of 16.2 percent. The commercials are Bullish with a score of 79.5 percent and the small traders (not shown in chart) are Bullish with a score of 61.9 percent.
| 2-Year Treasury Note Statistics | SPECULATORS | COMMERCIALS | SMALL TRADERS |
| – Percent of Open Interest Longs: | 7.7 | 81.6 | 8.6 |
| – Percent of Open Interest Shorts: | 27.5 | 62.8 | 7.7 |
| – Net Position: | -477,023 | 454,881 | 22,142 |
| – Gross Longs: | 186,740 | 1,972,486 | 207,471 |
| – Gross Shorts: | 663,763 | 1,517,605 | 185,329 |
| – Long to Short Ratio: | 0.3 to 1 | 1.3 to 1 | 1.1 to 1 |
| NET POSITION TREND: | |||
| – Strength Index Score (3 Year Range Pct): | 16.2 | 79.5 | 61.9 |
| – Strength Index Reading (3 Year Range): | Bearish-Extreme | Bullish | Bullish |
| NET POSITION MOVEMENT INDEX: | |||
| – 6-Week Change in Strength Index: | 6.6 | -9.7 | 8.7 |
5-Year Treasury Note Futures:
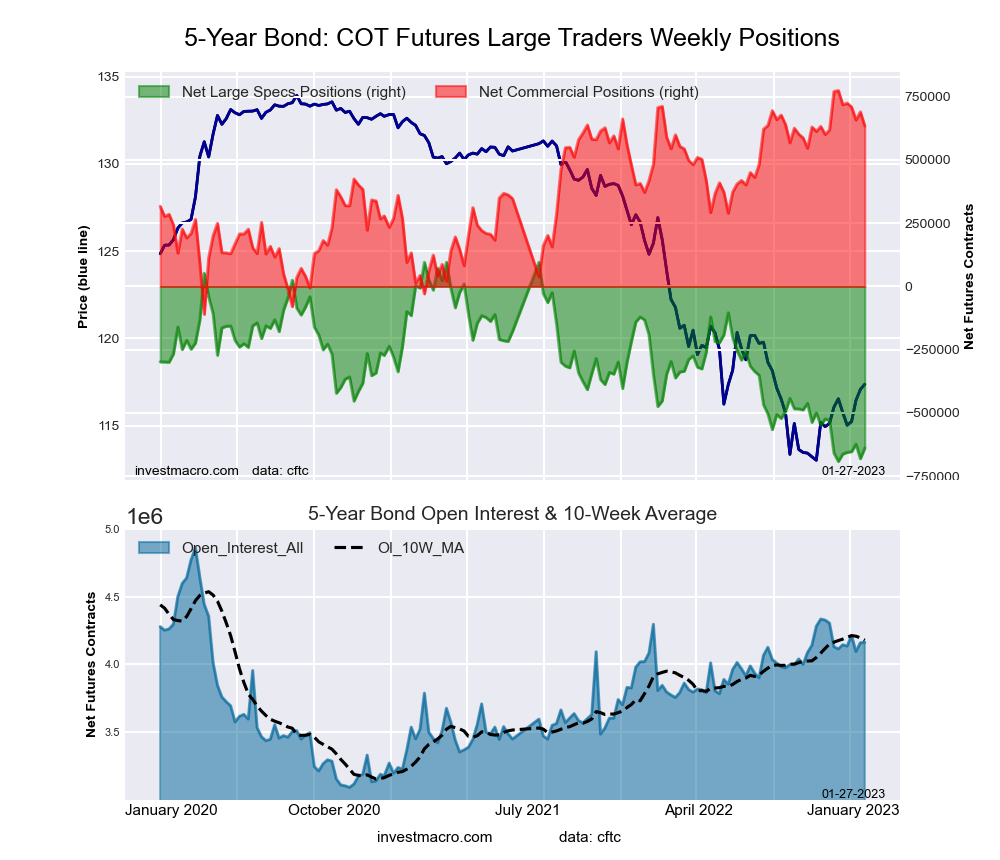
The 5-Year Treasury Note large speculator standing this week totaled a net position of -638,737 contracts in the data reported through Tuesday. This was a weekly rise of 41,918 contracts from the previous week which had a total of -680,655 net contracts.
This week’s current strength score (the trader positioning range over the past three years, measured from 0 to 100) shows the speculators are currently Bearish-Extreme with a score of 6.7 percent. The commercials are Bullish-Extreme with a score of 84.1 percent and the small traders (not shown in chart) are Bullish-Extreme with a score of 82.4 percent.
| 5-Year Treasury Note Statistics | SPECULATORS | COMMERCIALS | SMALL TRADERS |
| – Percent of Open Interest Longs: | 6.2 | 83.8 | 8.5 |
| – Percent of Open Interest Shorts: | 21.6 | 68.6 | 8.4 |
| – Net Position: | -638,737 | 633,820 | 4,917 |
| – Gross Longs: | 259,978 | 3,489,305 | 354,429 |
| – Gross Shorts: | 898,715 | 2,855,485 | 349,512 |
| – Long to Short Ratio: | 0.3 to 1 | 1.2 to 1 | 1.0 to 1 |
| NET POSITION TREND: | |||
| – Strength Index Score (3 Year Range Pct): | 6.7 | 84.1 | 82.4 |
| – Strength Index Reading (3 Year Range): | Bearish-Extreme | Bullish-Extreme | Bullish-Extreme |
| NET POSITION MOVEMENT INDEX: | |||
| – 6-Week Change in Strength Index: | 6.7 | -15.9 | 24.0 |
10-Year Treasury Note Futures:
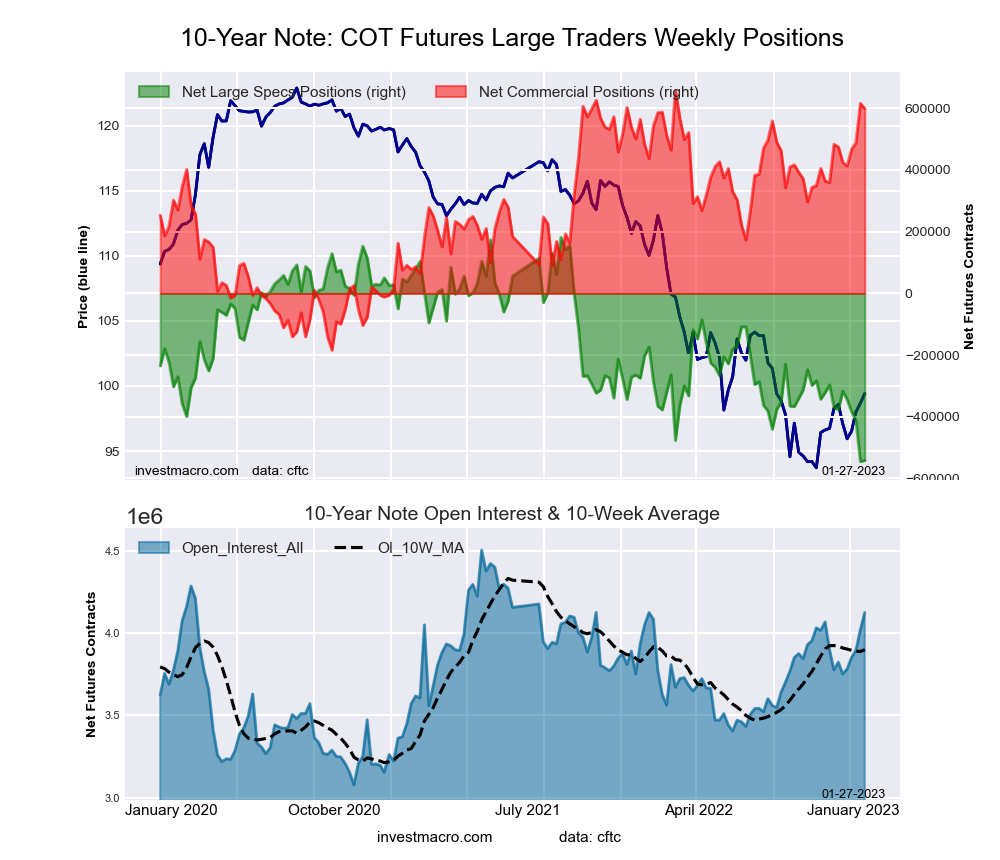
The 10-Year Treasury Note large speculator standing this week totaled a net position of -541,821 contracts in the data reported through Tuesday. This was a weekly boost of 3,236 contracts from the previous week which had a total of -545,057 net contracts.
This week’s current strength score (the trader positioning range over the past three years, measured from 0 to 100) shows the speculators are currently Bearish-Extreme with a score of 0.4 percent. The commercials are Bullish-Extreme with a score of 93.0 percent and the small traders (not shown in chart) are Bullish with a score of 66.5 percent.
| 10-Year Treasury Note Statistics | SPECULATORS | COMMERCIALS | SMALL TRADERS |
| – Percent of Open Interest Longs: | 8.7 | 80.3 | 8.7 |
| – Percent of Open Interest Shorts: | 21.8 | 65.7 | 10.1 |
| – Net Position: | -541,821 | 598,839 | -57,018 |
| – Gross Longs: | 359,177 | 3,310,111 | 360,007 |
| – Gross Shorts: | 900,998 | 2,711,272 | 417,025 |
| – Long to Short Ratio: | 0.4 to 1 | 1.2 to 1 | 0.9 to 1 |
| NET POSITION TREND: | |||
| – Strength Index Score (3 Year Range Pct): | 0.4 | 93.0 | 66.5 |
| – Strength Index Reading (3 Year Range): | Bearish-Extreme | Bullish-Extreme | Bullish |
| NET POSITION MOVEMENT INDEX: | |||
| – 6-Week Change in Strength Index: | -22.8 | 14.7 | 9.8 |
Ultra 10-Year Notes Futures:
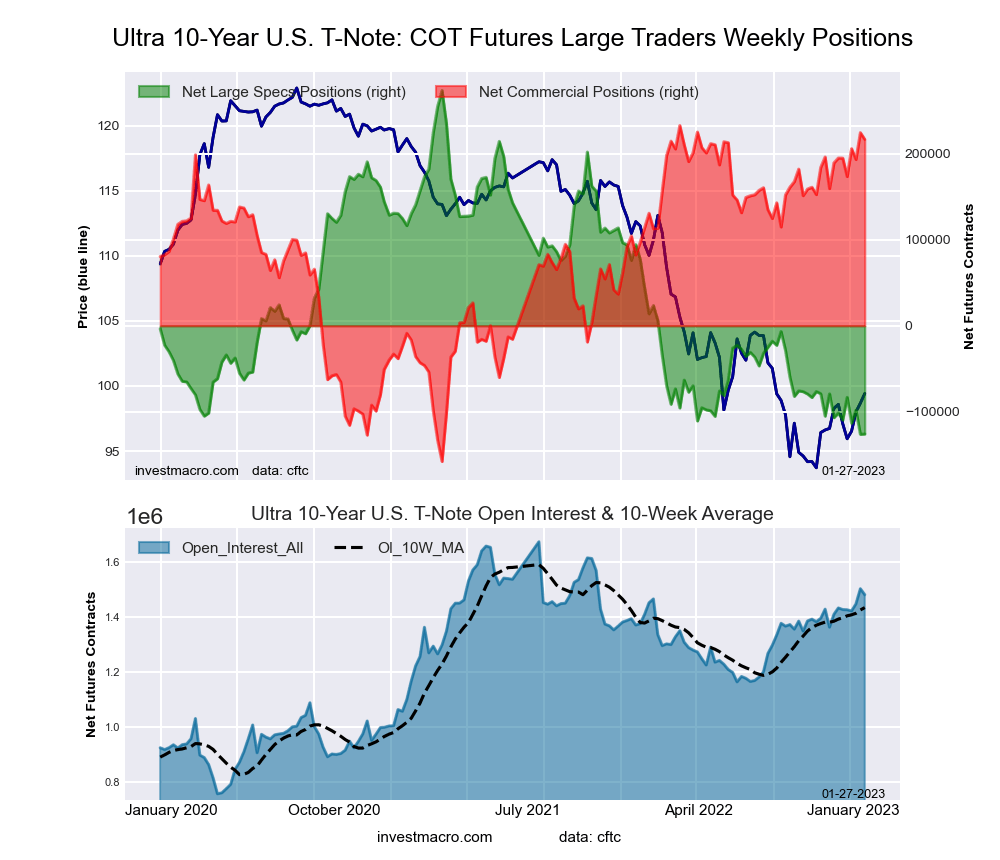
The Ultra 10-Year Notes large speculator standing this week totaled a net position of -125,911 contracts in the data reported through Tuesday. This was a weekly lift of 410 contracts from the previous week which had a total of -126,321 net contracts.
This week’s current strength score (the trader positioning range over the past three years, measured from 0 to 100) shows the speculators are currently Bearish-Extreme with a score of 0.1 percent. The commercials are Bullish-Extreme with a score of 95.9 percent and the small traders (not shown in chart) are Bullish with a score of 66.7 percent.
| Ultra 10-Year Notes Statistics | SPECULATORS | COMMERCIALS | SMALL TRADERS |
| – Percent of Open Interest Longs: | 10.7 | 77.5 | 10.5 |
| – Percent of Open Interest Shorts: | 19.2 | 62.9 | 16.6 |
| – Net Position: | -125,911 | 216,769 | -90,858 |
| – Gross Longs: | 158,914 | 1,148,114 | 155,215 |
| – Gross Shorts: | 284,825 | 931,345 | 246,073 |
| – Long to Short Ratio: | 0.6 to 1 | 1.2 to 1 | 0.6 to 1 |
| NET POSITION TREND: | |||
| – Strength Index Score (3 Year Range Pct): | 0.1 | 95.9 | 66.7 |
| – Strength Index Reading (3 Year Range): | Bearish-Extreme | Bullish-Extreme | Bullish |
| NET POSITION MOVEMENT INDEX: | |||
| – 6-Week Change in Strength Index: | -6.1 | 5.5 | 1.8 |
US Treasury Bonds Futures:
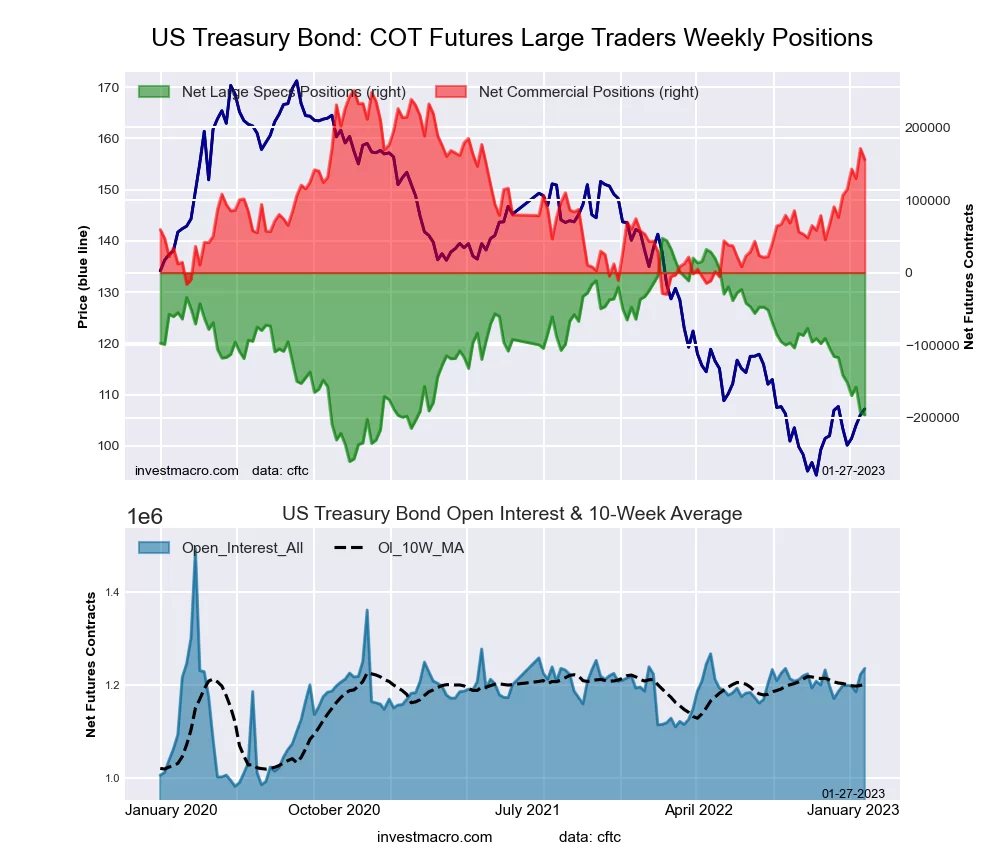
The US Treasury Bonds large speculator standing this week totaled a net position of -195,816 contracts in the data reported through Tuesday. This was a weekly reduction of -3,423 contracts from the previous week which had a total of -192,393 net contracts.
This week’s current strength score (the trader positioning range over the past three years, measured from 0 to 100) shows the speculators are currently Bearish with a score of 20.9 percent. The commercials are Bullish with a score of 66.1 percent and the small traders (not shown in chart) are Bullish-Extreme with a score of 84.4 percent.
| US Treasury Bonds Statistics | SPECULATORS | COMMERCIALS | SMALL TRADERS |
| – Percent of Open Interest Longs: | 4.2 | 80.9 | 14.5 |
| – Percent of Open Interest Shorts: | 20.0 | 68.3 | 11.2 |
| – Net Position: | -195,816 | 155,710 | 40,106 |
| – Gross Longs: | 51,463 | 1,000,159 | 178,920 |
| – Gross Shorts: | 247,279 | 844,449 | 138,814 |
| – Long to Short Ratio: | 0.2 to 1 | 1.2 to 1 | 1.3 to 1 |
| NET POSITION TREND: | |||
| – Strength Index Score (3 Year Range Pct): | 20.9 | 66.1 | 84.4 |
| – Strength Index Reading (3 Year Range): | Bearish | Bullish | Bullish-Extreme |
| NET POSITION MOVEMENT INDEX: | |||
| – 6-Week Change in Strength Index: | -25.7 | 28.3 | -0.3 |
Ultra US Treasury Bonds Futures:
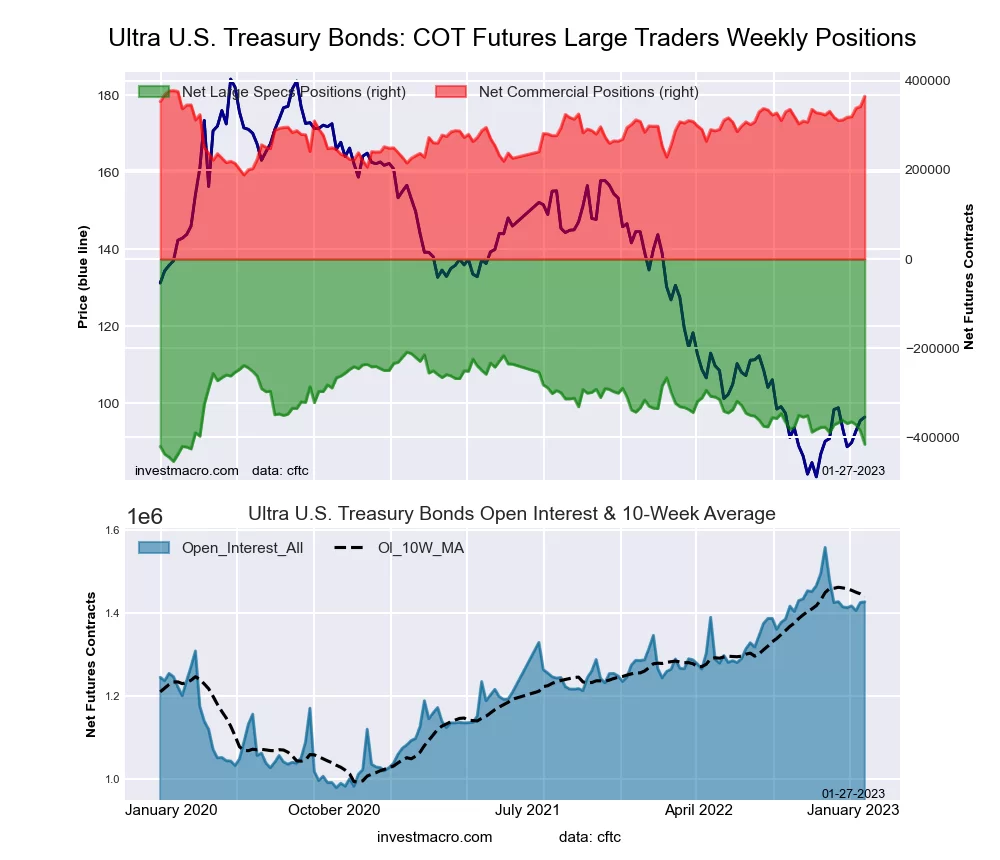
The Ultra US Treasury Bonds large speculator standing this week totaled a net position of -415,363 contracts in the data reported through Tuesday. This was a weekly lowering of -29,935 contracts from the previous week which had a total of -385,428 net contracts.
This week’s current strength score (the trader positioning range over the past three years, measured from 0 to 100) shows the speculators are currently Bearish-Extreme with a score of 4.8 percent. The commercials are Bullish-Extreme with a score of 100.0 percent and the small traders (not shown in chart) are Bullish with a score of 73.0 percent.
| Ultra US Treasury Bonds Statistics | SPECULATORS | COMMERCIALS | SMALL TRADERS |
| – Percent of Open Interest Longs: | 3.8 | 84.4 | 11.7 |
| – Percent of Open Interest Shorts: | 32.9 | 58.8 | 8.2 |
| – Net Position: | -415,363 | 365,215 | 50,148 |
| – Gross Longs: | 53,821 | 1,203,706 | 166,548 |
| – Gross Shorts: | 469,184 | 838,491 | 116,400 |
| – Long to Short Ratio: | 0.1 to 1 | 1.4 to 1 | 1.4 to 1 |
| NET POSITION TREND: | |||
| – Strength Index Score (3 Year Range Pct): | 4.8 | 100.0 | 73.0 |
| – Strength Index Reading (3 Year Range): | Bearish-Extreme | Bullish-Extreme | Bullish |
| NET POSITION MOVEMENT INDEX: | |||
| – 6-Week Change in Strength Index: | -22.2 | 30.9 | -5.1 |
*COT Report: The COT data, released weekly to the public each Friday, is updated through the most recent Tuesday (data is 3 days old) and shows a quick view of how large speculators or non-commercials (for-profit traders) were positioned in the futures markets.
The CFTC categorizes trader positions according to commercial hedgers (traders who use futures contracts for hedging as part of the business), non-commercials (large traders who speculate to realize trading profits) and nonreportable traders (usually small traders/speculators) as well as their open interest (contracts open in the market at time of reporting). See CFTC criteria here.
More By This Author:
Currency Speculators Retreat From US Dollar Index Bullish Bets To A 78-Week Low
COT Speculator Extremes: Soybean Meal, Ultra 10-Year Treasuries Lead Bullish & Bearish Positions
Bonds Speculators Increased 10-Year Treasury Bearish Bets To 222-Week High
Disclosure: Foreign Currency trading and trading on margin carries a high level of risk and can result in loss of part or all of your investment.Due to the level of risk and market volatility, ...
more

