
Corporate Debt Out-Of-Control Or Smart Business: Part 2
Introduction
In part 1 found here, Why Record Corporate Debt Might Not Be So Bad: 8 Debt-Laden Blue Chips – Part 1 of this two-part series, I pointed out that low-interest rates have been a strong motivating factor for publicly traded companies to utilize debt over equity to finance their operations. Simply stated, it is a lot cheaper for companies to issue debt than it is to issue equity. This has not only resulted in corporations becoming more highly leveraged than perhaps ever before, but it also has destroyed shareholder equity (book value) for many companies. These higher levels of debt and lower levels of shareholder equity (book value) had the additional side effect of collapsing the credit ratings of many publicly traded companies.
As evidence of that last point, in part 1, I reported that only 2 companies – Johnson & Johnson (NYSE: JNJ) and Microsoft (NASDAQ: MSFT) – are AAA rated today compared to 60 companies that held that coveted rating in the early 1990s. Additionally, I also shared a report pointing out that half of all investment-grade corporate debt is rated BBB or lower, and one-third of those companies rated BBB-, which is only one notch away from junk status.
In this part 2, I want to share an additional perspective that my research on the growing levels of corporate debt uncovered. In 2018 there was an excellent white paper produced by O’Shaughnessy Asset Management titled “Negative Equity, Veiled Value, and the Erosion of Price-to-Book.”
Many of the most debt-laden stocks that have negative equity have inexplicably outperformed the market most of the time. Moreover, as I will elaborate on later with a few examples, many of these highly leveraged companies are being awarded what appear to me to be excessive valuations. But perhaps more importantly, they have continued to command these high valuations for, in some cases, several years. The following excerpt from the introduction to the white paper pointed out some facts that have been confusing me for some time:
“O’Shaughnessy Asset Management
Negative Equity, Veiled Value, and the Erosion of Price-to-Book
RESEARCH BY TRAVIS FAIRCHILD, CFA: APRIL 2018
The price-to-book ratio has a problem. More and more U.S. companies report negative book value, the result of accounting rules and structural changes in the market. This creates broad confusion and problems for the famous value factor, and indexes or strategies which rely on it as a measure of cheapness. Negative equity companies are often written off as distressed, but after reporting negative equity, most of them survive for years and have, as a group, outperformed the market 57% of the time.(For the other valuation factors, we use Price to Sales, Price to Earnings, EBITDA to Enterprise Value, Free Cash Flow Yield, and Shareholder Yield.)”
In addition to the mysterious high valuations that these debt-laden companies continue to command, the above white paper also pointed out that part of the problem may be caused by the evaluation of distorted balance sheet levels. They posited that balance sheet distortions are comprised of 3 main categories:
“1) Understated Intangible Assets: brand names, human capital, advertising, and research and development (R&D) are rarely represented on the balance sheet
2) Understated Long Term Assets: assets are often depreciated faster than their useful lives
3) Buybacks and Dividends: when buybacks and dividends exceed net income, they create a decrease in equity which can accelerate distortions”
To summarize, O’Shaughnessy asset management is suggesting that generally accepted accounting principles (GAAP) is doing a very poor job reflecting the true value of shareholders’ equity. They attributed this growing understatement of shareholders’ equity to significant understatements of intangible assets resulting from an overzealous attempt to accurately reflecting what constitutes an operating expense versus a capital expense. The following excerpt presents their logic:
“This distinction is not at all trivial and will affect the balance sheet in very different ways. Operating expenses are meant to provide benefits in only the current period and are therefore a onetime expense. Capital expenses create value over multiple periods and are capitalized, creating an asset that is depreciated until it no longer adds any value to the company.”
For a more comprehensive understanding of the implications in which these expenses are potentially improperly applied, I suggest you follow the link above and read the entire white paper. However, for purposes of this article, I will summarize their logic as follows. Expenses do need to be properly accounted for and GAAP accounting does its best to accomplish that. However, this currently often causes the value of certain true assets to be at worst excluded, and at best understated. On the other hand, since these assets are primarily intangibles, there is no ironclad or concrete way to properly value them under current accounting standards or perhaps even otherwise.
The value that things such as R&D expenses and advertising expenses add to a company’s value primarily take the form of brands, patents, intellectual property, and technology processes that can only be estimated because of their intangible nature. Since you cannot weigh them or measure them in traditional ways, they are essentially given no value on the balance sheet. Yet in truth, these expenses create incredible value for the companies that are spending significant amounts on them. And to compound the problem even more, at least according to the white paper, today’s major service corporations are spending much more on R&D than they did prior to accounting changes in 1975. Healthcare and IT are specifically cited as examples in the paper.
In part 1, I presented 3 examples of companies that had taken on significant debt. In part 2, I will cover 4 additional examples. However, all my examples in both part 1 and this part 2 were taken from the following graphic which I prepared:
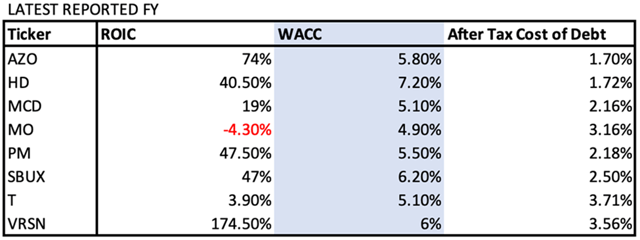
Returns on Invested Capital versus Weighted Average Cost Of Capital versus After-Tax Cost Of Debt
Note that most of these companies had returns on invested capital significantly higher than the after-tax cost of debt. In other words, these companies were borrowing money very inexpensively and earning significantly higher returns on their invested capital than it was costing them to obtain it.
However, there are two exceptions. The first is AT&T (NYSE: T), which essentially is earning a return on invested capital that is only slightly higher than their after-tax cost of debt. However, as you will see in the graphics later, AT&T is the only company that is growing their common equity or book value.
The second exception is Altria (NYSE: MO) that is reporting a negative return on invested capital as of the end of the last fiscal year. However, with this example, there are extenuating circumstances. The company experienced two enormous impairment charges because of their investment in the vaping company JUUL, and to a lesser extent in the cannabis company Cronos.
These two exceptions provide me the opportunity to once again point out that it is a market of stocks and not a stock market. Consequently, I suggest that investors make their judgments based on the specific situation of each individual company that they are evaluating and avoid falling into the trap of overgeneralization.
Balance Sheet Perspectives: Altria Group (MO), Philip Morris (PM), AT&T (T) and AutoZone (AZO)
As I stated in part 1, strong balance sheets represent the foundation of a company’s quality and its value. However, balance sheets have become significantly more difficult to evaluate in our modern economy. Stated colloquially, the balance sheets of today’s companies are not our grandfather’s balance sheets. Changes in accounting rules and the nature of service businesses with intangible assets versus industrial businesses with tangible assets create challenging comparisons. In short, price-to-book value no longer serves as a sacred valuation metric. In fact, many of our most revered companies today report negative equity and yet continue to outperform for years and years.
Although I have been discussing eight debt-laden blue chips with this article series, for brevity’s sake I offered the summary balance sheet, cash flow statement, and income statement analysis of three iconic brands in part 1. In this part 2, I offer 4 additional examples (however, and only once again for brevity’s sake, I have left out presenting the eighth company on my graphic VeriSign): Altria Group, Philip Morris, AT&T, and AutoZone. Interestingly, you will discover that of these 4 companies only Philip Morris International and AutoZone have negative shareholders equity on their balance sheets.
Balance Sheet Perspectives:
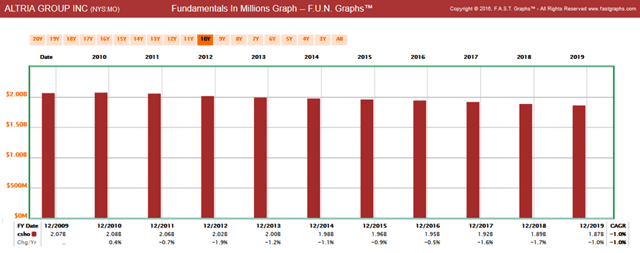
Altria Group: Long-Term Debt and Total Debt Since 2008
The following FUN Graph (fundamental underlying numbers) looks at total debt and long-term debt on both a per-share and a total in millions basis. Later, I will show common shares outstanding (share buybacks) over the same timeframe. I believe it is important to evaluate debt from both these perspectives.
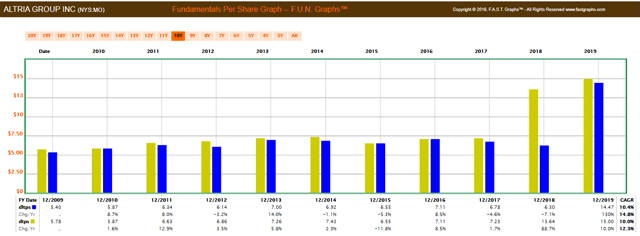
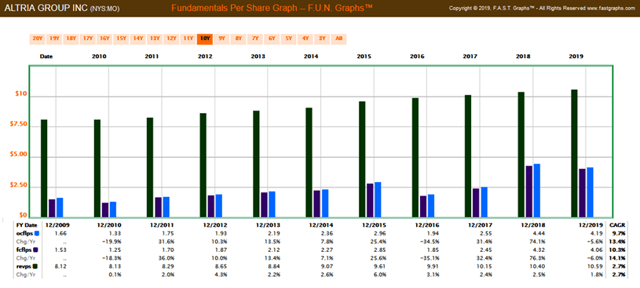
Altria Group: Debt per Share
Altria’s long-term debt per share and total debt per share have increased by 10.4% and 10% respectively. However, it is also important to note that most of their debt is long-term in nature.
Altria’s Long-Term Debt Per Share and Total Debt Per Share
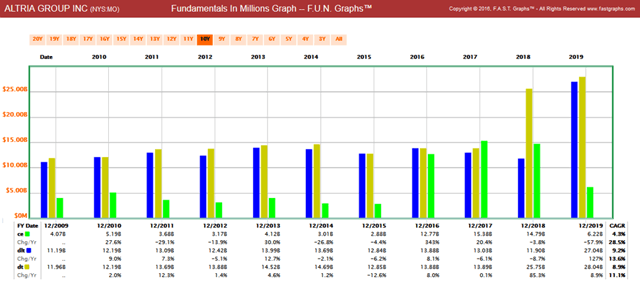
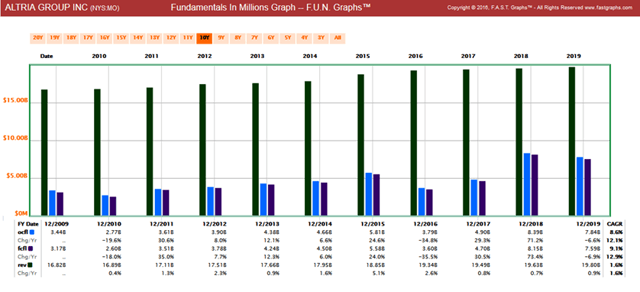
Altria: Long-Term Debt and Total Debt Plus Common Equity in Millions
Altria’s gross long-term debt and total debt has increased by a compound annual growth rate average (CAGR) of 9.2% and 8.9% respectively. Importantly, this led to a reduction of common equity (book value) by 2019.
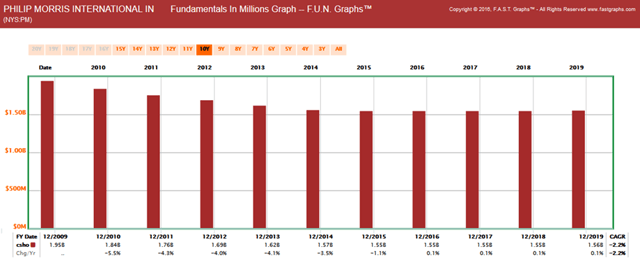
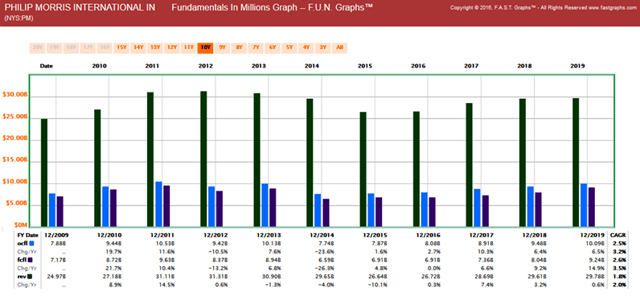
Philip Morris International: Long-Term Debt and Total Debt Since 2008
The following FUN Graph (fundamental underlying numbers) looks at total debt and long-term debt on both a per-share and a total in millions basis. Later, I will show common shares outstanding (share buybacks) over the same timeframe. I believe it is important to evaluate debt from both these perspectives.
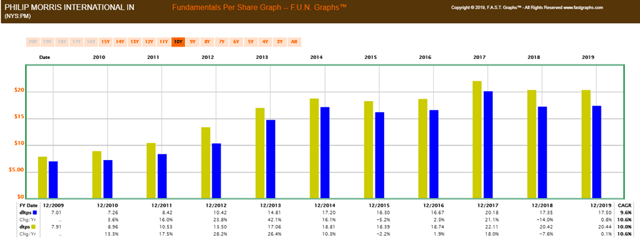
Philip Morris: Debt per Share
Philip Morris’ long-term debt per share and total debt per share have increased by a compound annual growth rate average (CAGR) of 9.6% and 10% respectively. However, it is also important to note that most of their debt is long-term in nature.
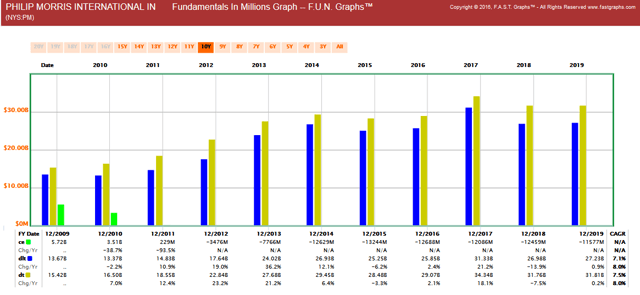
Philip Morris: Long-Term Debt and Total Debt Plus Common Equity in Millions
Philip Morris’ gross long-term debt and total debt has increased by a compound annual growth rate average (CAGR) of 7.1% and 7.5% respectively. Importantly, this led to the destruction of common equity (book value) by 2010. Negative shareholders’ equity has continued to be reported ever since.
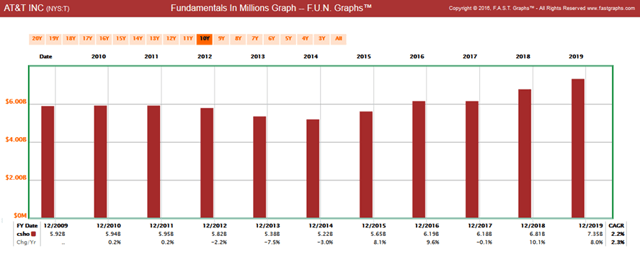
AT&T: Long-Term Debt and Total Debt Since 2008
The following FUN Graph (fundamental underlying numbers) looks at total debt and long-term debt on both a per-share and a total in millions basis. Later, I will show common shares outstanding (share buybacks) over the same timeframe. I believe it is important to evaluate debt from both these perspectives.
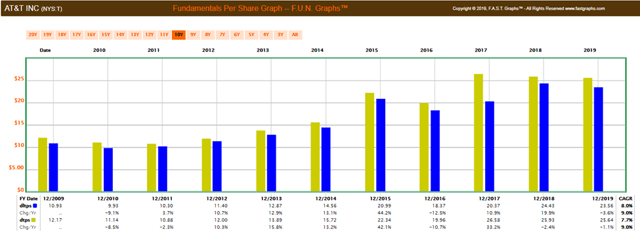
AT&T: Debt per Share
AT&T’s long-term debt per share and total debt per share have increased by a compound annual growth rate average (CAGR) of 8% and 7.7% respectively. However, it is also important to note that most of their debt is long-term in nature.
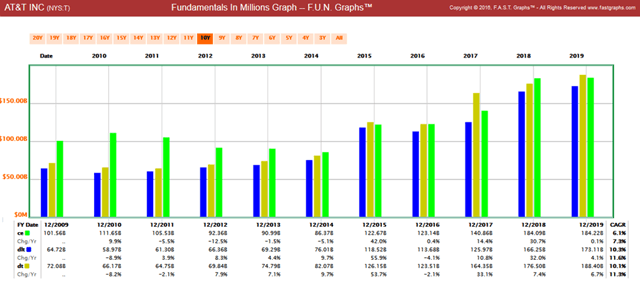
AT&T: Long-Term Debt and Total Debt Plus Common Equity in Millions
AT&T’s gross long-term debt and total debt has increased by a compound annual growth rate average (CAGR) of 10.3% and 10.1% respectively. Importantly, in contrast to my other examples, AT&T has managed to increase shareholders’ equity by an average of 6.1%. Therefore, even though AT&T carries a lot of debt, the company’s long-term debt to capital is a manageable 45% and the company has been able to increase shareholder equity.
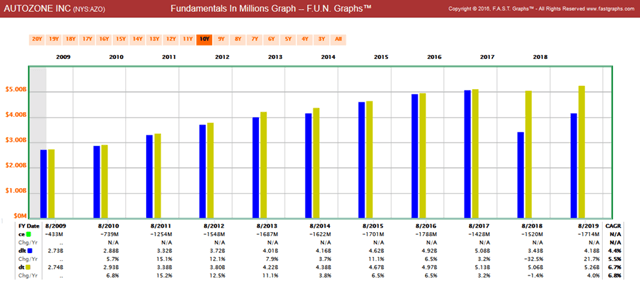
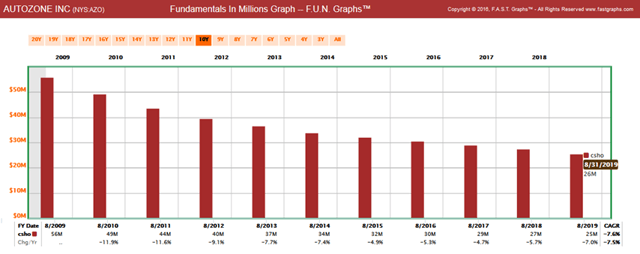
AutoZone: Long-Term Debt and Total Debt Since 2008
The following FUN Graph (fundamental underlying numbers) looks at total debt and long-term debt on both a per-share and a total in millions basis. Later, I will show common shares outstanding (share buybacks) over the same timeframe. I believe it is important to evaluate debt from both these perspectives.
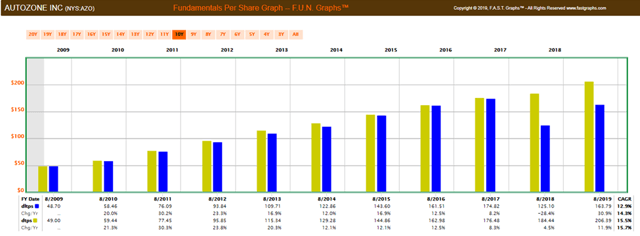
AutoZone: Debt per Share
AutoZone’s long-term debt per share and total debt per share have increased by a compound annual growth rate average (CAGR) of 12.9% and 15.5% respectively. However, it is also important to note that most of their debt is long-term in nature.
AutoZone: Long-Term Debt and Total Debt Plus Common Equity in Millions
AutoZone’s gross long-term debt and total debt has increased by a compound annual growth rate average (CAGR) of 4.4% and 6.7% respectively. Importantly, AutoZone has reported negative shareholders’ equity since fiscal year 2009 and negative shareholders’ equity has continued to balloon ever since.
Income Statement Perspectives: Shareholder Buybacks (common shares outstanding) Altria Group, Philip Morris, AT&T and AutoZone
Altria’s Share Buybacks (common shares outstanding) Since 2009
Altria has been buying back common stocks since 2009. However, it only reduced their share count on average by 1% per annum over that timeframe. Clearly, Altria has not been a reckless purchaser of their own shares.
Philip Morris’ Share Buybacks (common shares outstanding) Since 2009
Philip Morris International has also been conservative with share buybacks averaging 2.2% per annum since 2009.
AT&T’s Share Buybacks (common shares outstanding) Since 2009
In contrast to the other examples, AT&T has been increasing their share count since 2014. This partially explains why the company has also increased shareholders’ equity (book value). In other words, AT&T has been funding their business with both debt and equity.
AutoZone’s Share Buybacks (common shares outstanding) Since 2009
Of all the companies I have shown thus far, AutoZone has been the most aggressive buyer of their own shares. Simultaneously, they have also been aggressively issuing debt which explains why their shareholders’ equity disappeared after fiscal year 2008.
Cash Flow and Income Perspectives: Altria Group, Philip Morris, AT&T, and AutoZone
As I previously stated, in today’s day and age of massive share buybacks, I believe it is both useful and enlightening to look at important fundamental metrics on both a gross and a per-share basis. Share buybacks do reward existing shareholders by providing them a larger stake in the business. Consequently, existing shareholders do benefit from buybacks, and of course through greater dividends as a result.
On the other hand, share buybacks are clearly also a form of financial engineering that companies can utilize to improve their numbers (for example: earnings and dividends per share). However, from a non-shareholder's perspective, I believe it is also useful to look at gross numbers to see to what extent improvements in earnings and dividends are attributable to engineering versus organic business success.
Altria Group: Gross Revenues and Cash Flows Versus Per-Share Revenues and Cash Flows
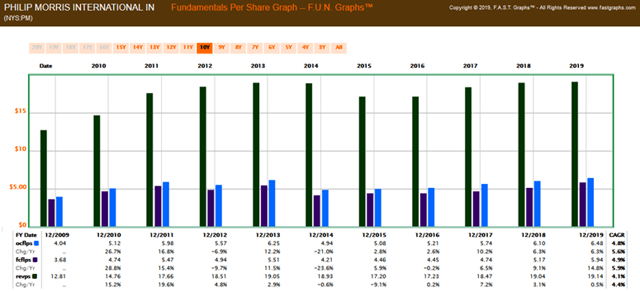
Philip Morris: Gross Revenues and Cash Flows Versus Per-Share Revenues and Cash Flows
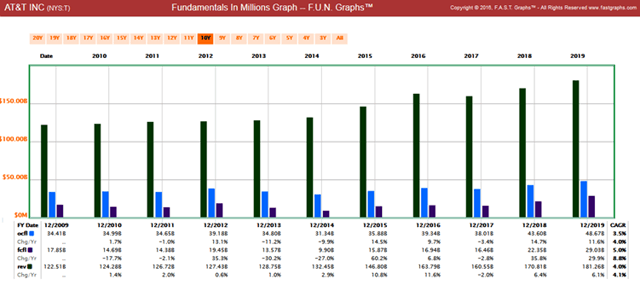
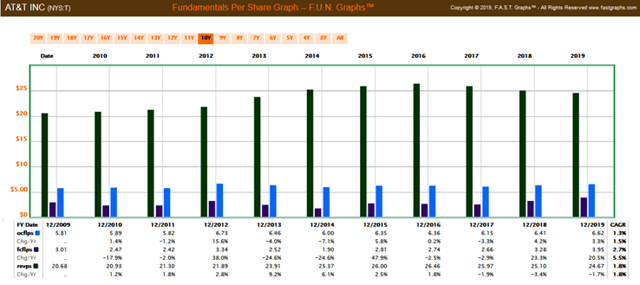
AT&T: Gross Revenues and Cash Flows Versus Per-Share Revenues and Cash Flows
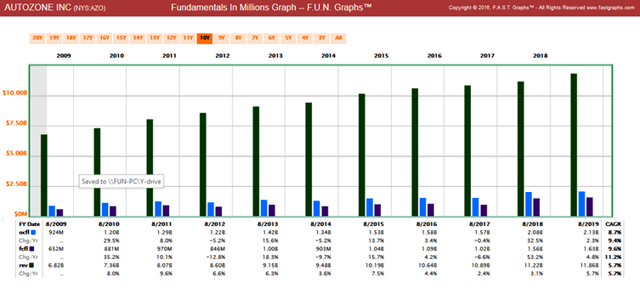
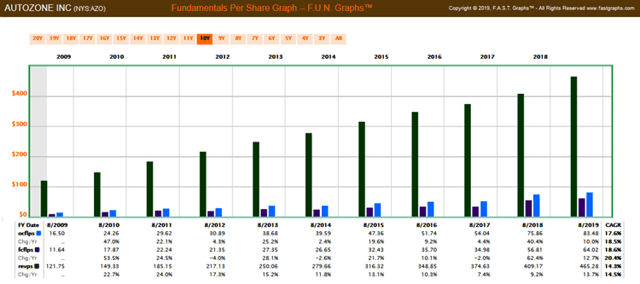
AutoZone: Gross Revenues and Cash Flows Versus Per-Share Revenues and Cash Flows
Cash Flow and Revenues Support the Ability to Retire Debt
From what I showed above, I believe each of the four examples are generating the revenues and cash flows to support and eventually retire their debt.
FAST Graphs Analyze Out Loud Video: Valuation and Share Buybacks
For me personally, I neither generally support nor reject utilizing debt for share buybacks. However, I do reject share buybacks when valuations are high. I do this on the basis that if I am not willing to invest in the stock due to high valuation, then management should not be investing in their stock either. Therefore, in the following analysis out loud video, I will look at share buybacks in contrast to the valuations of each of the four companies I covered in this video. As I previously stated, judgments regarding these issues should be made on a case-by-case basis and not generally. It is a market of stocks not a stock market.
Why Are Interest Rates So Low
In part 1, I was asked in a comment to discuss why interest rates have gotten so low. Although I do not pretend to have a good answer, there have been reports attempting to answer that question. On August 10, 2019, Allison Schrager posted an article in Quartz providing her rationale which was primarily related to government debt as follows:
“Why are rates so low?
Interest rates are market prices, which means they are a function of the supply and demand of bonds. There is plenty of supply—the US is running a many-trillion dollar debt and needs to sell bonds to pay for it—but not enough to satisfy all the demand for its debt at higher interest rates. The demand is driven by an insatiable desire for low-risk assets. Bonds are generally seen as a less risky asset than stocks. Unlike most other assets, they offer certain payments for a fixed amount of time. Even if the company or country that issued the bond goes bust, bond holders are often still paid something. Of course, some countries and companies are risker than others. The riskier a bond is, the more it normally pays, since investors are compensated for taking risk.”
So according to Allison, she attributes low rates to the insatiable demand for low-risk assets and the government’s desire to satisfy that demand through the massive issuing of bonds. Of course, government intervention designed to keep deflation in check while stimulating economic growth would be another reason.
Then of course would be the argument that investors demand higher yields when inflation is high to compensate them for the deflated value of their dollars (money). And of course, others would argue that low-interest rates are being artificially controlled by government.
So, although I do not have a good answer personally, I would direct the reader to an interesting article written by Ben Bernanke on March 30, 2015. Of course, he is the past chairman of the Federal Reserve and now part of the Brookings institute. Although the article is somewhat out of date, I do believe it provides insights into why interest rates are so low.
Summary and Conclusions
From what I have learned and presented in this series of articles, I have acquired a slightly different outlook on debt as it relates to publicly traded companies. As an old-school traditionalist, I have never liked companies that carry a lot of debt. In that regard, I would still say that I prefer companies with little or no debt.
On the other hand, it is hard to argue with the reality of how cheap it is for companies to issue debt today in relation to what they can earn on their invested capital. Simply stated, debt as a source of capital is now just too cheap to ignore. Therefore, it is arguable at least, that what was once considered reckless behavior regarding debt could now be thought of as smart instead.
Additionally, even though companies might be earning high returns on debt, I still believe it is important to be prudent. Furthermore, to the extent that debt is potentially damaging corporate balance sheets, there are other considerations. In other words, the asset side of the balance sheet may be being grossly understated for companies with intangible assets that invest heavily in R&D and advertising. I think we must at least be willing to consider the reality that debt to capital ratios are being inflated because much of the companies’ goodwill – which actually does have value – is not being given any credit until the company sells or merges.
But at the end of the day, even though corporations with strong cash flows and revenue growth might be capable of handling their debt and even retiring it, I still believe high levels of debt should be concerning. There might be practical reasons why companies are turning to debt. But as we all know, debt must eventually be repaid. Interesting times.
If you’re primarily interested in investing in high-quality dividend growth stocks, I would like to respectfully suggest looking at The Dividend Kings. The service is dedicated towards identifying the highest-quality dividend growth stocks that can be purchased at sound and attractive valuations. Take advantage of our 14 day free trial and see how we can help you identify the most attractive blue-chip dividend growth stocks for your portfolios.
Disclaimer: The opinions in this document are for informational and educational purposes only and should not be construed as a recommendation to buy or sell the stocks mentioned or to solicit ...
more

