
Coronavirus Hits Stock Market At Critical Turning Point
Fear about global economic effect resulting from the coronavirus pandemic hit the stock market hard the week of February 24-28, 2020. The institutional barometer for U.S. stock market performance, the Standard & Poor’s 500, had hit a record high of 3393.52 just three trading days earlier, on February 19. Within seven trading days, the S&P 500 declined more than 500 points and more than 15%.
As a financial astrologer, I’ve been watching the S&P 500 closely for signs of a high between 2018 and 2020 that could be the ultimate or penultimate high in a 45-year economic cycle between Saturn and Uranus that began in 1988 and ends in 2032. In previous cycles, this high was followed by market declines of 47% (1973-1974) and 89% (1929-1932).
Several strong potential dates for this significant high, based on my astrological work, have come and gone in the last two years. But, February 21, 2020—two days after the market topped—was one of the strongest, and one that I called out two years earlier in my book, “Trading In Sync With Commodities—Introducing Astrology To Your Financial Toolbox.”
Astrological Anatomy of the Feb. 19, 2020 S&P 500 High
This biwheel shows the March 4, 1957 launch horoscope of the S&P 500 index in the center, with the transits for the day of the all-time high of 3393.52 on February 19, 2020 on the outside. Because the S&P 500 index launched when the New York Stock Exchange opened at 10 am, I use that same time for all transit charts, even though the market now opens at 9:30 am.
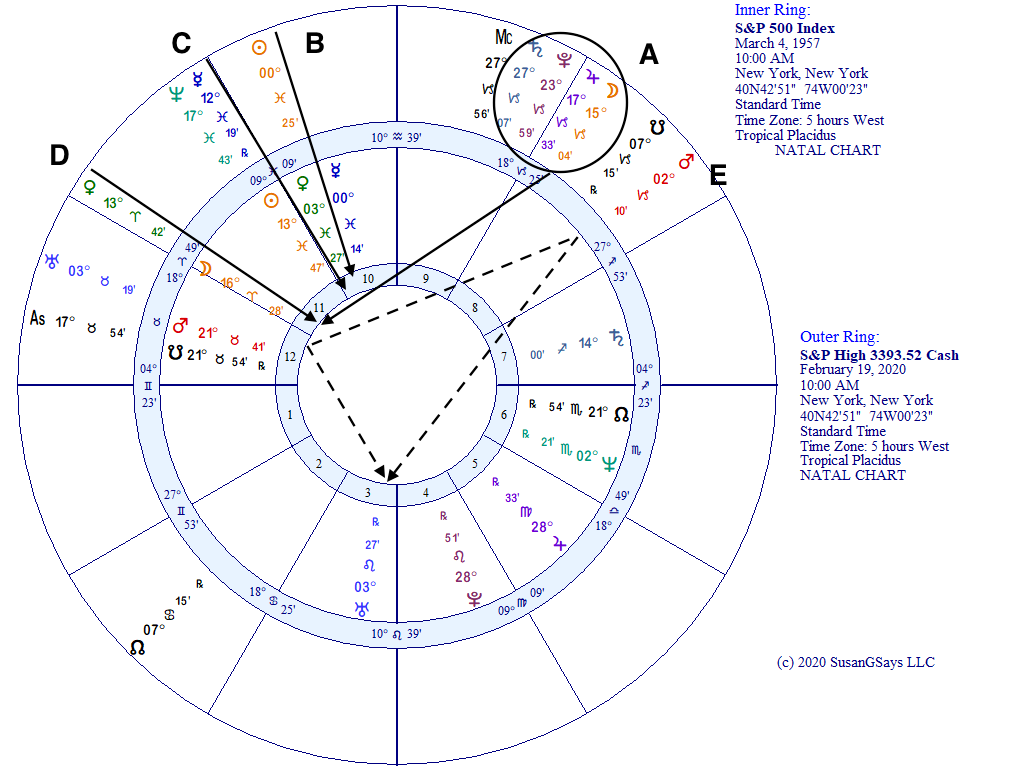
A—Transiting Moon and Jupiter in Capricorn were square to the index natal Moon in Aries. (Pluto is square to natal Mars; Saturn is a little far away.)
D—Transiting Venus was conjunct the index natal Moon.
B—Transiting Sun was partile (same degree) conjunct natal Mercury at 00 Pisces.
C—Transiting Mercury was conjunct the index natal Sun.
E—Transiting Mars and Uranus were within two days of their exact 120-degree trine, and both connected to the market’s natal Uranus at 03 Leo. (90-degree square from transiting Uranus; 150-degree quincunx from transiting Mars).
I had picked two days later, February 21, as a market turning point for two main reasons: (1) the Mars/Uranus trine was exact at 4:10 am; and (2) transiting Sun was at 02 Pisces, splitting the difference between natal Mercury and Venus. (On that day, the transiting Moon was conjunct the index midheaven rather than square the index Moon.)
Clearly, the transiting Moon’s square to its natal position on Wednesday, February 19 was the key, especially as it was fortified by nearby Jupiter. All the rest of the transit/natal connections were essentially the same on Friday, February 21.
Was 3393 in the S&P 500 “THE” High?
It very well could be. But, a couple of factors—both astrological and technical—suggest that “THE” high could arrive later. Still, I think the window of opportunity to set a higher high exists only into early May 2020.
First, from an astrological perspective, the current high of 3393 is 5 points beyond a price level of 3388 found by converting Pluto’s zodiacal position in the S&P 500 natal horoscope into price. No other high in the last 40 years that I researched for my book fell near a Pluto conversion level.
Indeed, significant turns in the S&P 500 (highs in 1987, 1999 and 2015; lows in 2015 and 2016) gravitated toward the Venus/Sun conversion levels. The Venus/Sun levels beyond the current record high are 3573-3583. (The caveat is that Pluto is playing an important role in this year’s overall astrological outlook, so a high near its conversion level could be an exclamation point to that.)
Second, from a technical analysis perspective, February’s trading action created an ominous “key reversal” on the monthly price chart. That means: (1) February’s high was higher than January’s; (2) February’s low was lower than January’s; and (3) February’s month-end close was lower than January’s. However, similar monthly key reversals were not fatal to market trends, but rather often seen mid-trend, or within a few months of the ultimate high.
Indeed, a monthly key reversal did not mark the highs that are considered poster children for big highs by market-watchers, including those in August 1987 (preceding the Crash of 1987), March 2000 (preceding the dot.com bubble burst), and October 2007 (preceding the financial crisis). The cyclical high I have been watching for will be in this category of importance on an historical basis.
Three Dates for Potential Highs
Beyond February 21—by far this year’s strongest candidate for a high in the S&P 500 from an astrological perspective—I have identified three more dates this spring that have the potential for at least market strength, if not a new high.
March 3—This is the day before the S&P 500’s birthday, when the transiting Sun is aligned with the index’s natal Sun. That’s strong, but we’re too close to the recent rout for this day to mark a new high.
April 13—The day after Easter is rather weak and is a toss-up between a low or a high. Arguing for a high are that Mars and Venus are aligned with the S&P 500’s natal horoscope midheaven and ascendant, respectively.
May 13—This day is the last chance for a stock market high until after the presidential election in November, in my opinion. Mars is making a strong connection to the S&P 500’s natal Mercury, the first such alignment in two years. More important, though, is that three planets associated with the economy and money turn retrograde in motion this week—Saturn on May 11, Venus on May 13 and Jupiter on May 14—and could be bearish. All three are not direct again until September 28.
Watch Circuit Breakers During High Volatility
As we’ve seen this last week, trading ranges expand and volatility increases near significant market turns. However, none of the week’s daily declines have approached critical, crash-like levels that triggered market “circuit breakers.”
After the stock market crash in 1987, when the S&P 500 dropped 21% in one day, circuit breakers were initiated to close all stock markets and related derivative markets for a certain period of time upon reaching certain declines to give everyone time to take a deep breath. (To those of us from the futures industry, this is akin to daily price limits.) Since then, circuit breakers have been tripped just once, on October 27, 1997, during the Asian financial crisis when the S&P 500 fell 65.91 points, or 7%.
The current circuit-breaker levels and their associated trading halt durations during NYSE trading hours are: (1) down 7%, 15 minutes; (2) down 13%, 15 minutes; (3) down 20%, close for the day. In overnight trading hours, a drop of 5% would bring a complete halt until the next morning’s open.
At S&P 3000, here are the circuit breaker numbers to keep in mind
- -5% = 150 points, 2850
- -7% = 210 points, 2790
- -13% = 390 points, 2610
- -20% = 600 points, 2400
Time to Pay Attention to Your Portfolio
As I’ve been saying to audiences and readers for the last two years, the stock market high established in 2018-2020 is one that likely will precede a drop of near 50% into the mid-2020s, and could remain in place for several years, if not decades.
Clearly, February 19, 2020 could be that high. But, based on my couple other observations discussed above, I’ll likely hold my final opinion on that until we get through mid-May.
In either case, now is the time to pay attention to your own investment portfolio and work with your financial advisor to help you weather what I believe will be an ugly storm.


