
Core Inflation Is Probably A Better Measure Of The Trend
Inflation is topical again. The crowd is becoming increasingly concerned that a combination of factors, including ramped-up fiscal spending and ongoing monetary stimulus, will conspire to unleash firmer pricing pressure. By some accounts, inflation is set to spiral higher and threaten the price stability that’s prevailed for several decades.
But the future’s still uncertain and so there’s a lively debate about how much a threat inflation actually poses. That’s in part because the economic and demographic forces that created disinflationary trends aren’t going away — aging workforce, global savings glut, expanding array of technologies that enhance efficiency, etc.
Regardless of how you’re thinking about inflation, monitoring the trend is a top priority these days and on that front core measures are usually the better choice over the more widely reported headline counterparts.
Core inflation strips out energy and food prices from mix, an adjustment that often elicits howls of criticism from some corners. Consumers, after all, don’t have the luxury of living in a core-inflation world. True, but the goal of core inflation is not to estimate how current inflation is affecting the overall population. Rather, the aim is two-fold: estimate a robust measure of the inflationary trend with an eye on making a reasonable forecast of where it’s headed. By those standards, core measures of inflation are usually the better choice.
Let’s dig into the numbers to illustrate why that’s so. Before we begin, we’ll cut to the chase and note that core inflation continues to reflect low and, in recent history, a declining inflationary trend. The core Consumer Price Index (CPI), for example, slipped to a 1.3% annual pace in February (red line in chart below) – close to the lowest rate in over a decade and well below the Federal Reserve’s 2% inflation target.
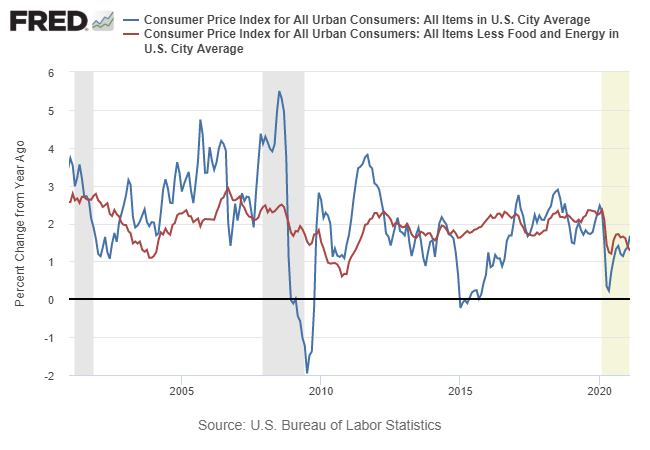
Why should we put more stock in core inflation vs. headline? Let’s start with an empirical fact that’s clearly illustrated in the chart above: headline CPI fluctuates relatively widely around core. Sometimes headline inflation is substantially higher, sometimes lower. But headline inflation never permanently diverges from core and so history suggests that headline volatility is closer to noise relative to core’s signal.
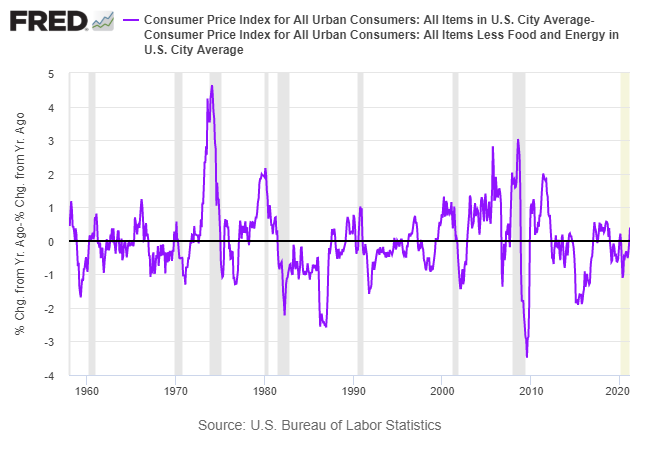
We can quantify the core-reverting profile in several ways. One is to review how the difference in headline less core inflation varies through time, as shown in the next chart below. The fact that the difference cycles around zero is a critical point because it shows that the difference is stationary and exhibits a relatively constant mean. That’s persuasive econometric evidence that headline data has a relatively high level of noise vs. core’s signal. In short, the difference exhibits no trend, which is a compelling sign of a stable, mean-reverting time series. (The mean difference for headline less core CPI on a rolling one-year basis is virtually zero for data starting in 1958 through last month.)
Another test is to use core CPI as a one-year-ahead forecast of headline CPI and compare the results against using headline as a predictor of itself over the same time frame. To measure the degree of accuracy we’ll use a standard statistical tool: root-mean-square error (RMSE), which quantifies the variation in prediction errors. A higher RMSE indicates greater variation, which translates into a less-accurate forecast. A perfect prediction would have an RMSE of zero.
On that score, core fares better. Using core CPI to forecast year-ahead headline CPI generates an RMSE of 0.0203 since 1959. By contrast, using headline CPI to predict itself a year ahead generates an RMSE of 0.0466, or more than twice as high as the core model.
Note, too, that the correlation in the annual inflation data is higher for the core vs. year-ahead headline numbers: roughly 0.72 through the decades. By contrast, the correlation between current headline one-year changes vs. the year-ahead headline annual pace is lower at: 0.56. This is another bit of statistical support for thinking that core does a better job of anticipating year-ahead inflation.
Finally, let’s recognize that there are many ways to measure inflation. Like any one methodology, each comes with its own set of pros and cons and so looking beyond CPI is essential. But most of the alternative measures of inflation tell a story that echoes the core CPI trend: inflation remains low with minimal, if any, signs of trending higher.
For example, the Atlanta Fed’s Core Sticky Price Consumer Price Index shows a clear downside bias in recent history. The adjustment here is to focus on prices of goods and services that change infrequently, which “are thought to incorporate expectations about future inflation to a greater degree than prices that change on a more frequent basis. One possible explanation for sticky prices could be the costs firms incur when changing price. For further information about Sticky Price CPI.”

The low level of inflation could rebound, of course, and probably will, at least temporarily as the disinflation/deflation data during the initial stages of the coronavirus crisis last year washes on the year-over-year comparisons. In fact, as CapitalSpectator.com discussed earlier this month, a reflationary rebound is destiny in the short term.
Deciding if a temporary bout of reflation will lead to a longer-lasting run of higher inflation, on the other hand, remains open for debate, based on recent core readings of inflation.
Disclosures: None.


