
Consumers & Low Income Wage Growth Look Good
We’re getting more information on retail sales that supports the theme that holiday shopping was pushed to December and that this was overall a good shopping season for the consumer. Real wage growth looks very strong for non-supervisory and production workers who make up about 80% of the labor force. Plus, for upper-income workers, the stock market is rallying. It’s fairly straightforward that this should be a strong holiday season for the consumer.
Since 2014, the best shopping day of the year has been Super Saturday, not Black Friday. This Super Saturday was no different as sales were $34.4 billion as you can see from the chart below. That’s 10% above Black Friday’s sales of $31.2 billion.
“Super Saturday” (a couple of days ago) was largest US shopping day ever … shoppers shelled out $34.4b, slightly above Black Friday’s $31.2b @business pic.twitter.com/m0FCEKNXBh
— Liz Ann Sonders (@LizAnnSonders) December 23, 2019
This Super Saturday was boosted by the late Thanksgiving and the fact that it was the day before the first day of Hanukkah. The next biggest day was December 14th which had $28.1 billion; finally, there was Cyber Monday which had $19.1 billion in sales. 58% of sales growth came from online sales. Yearly sales growth in the non-store category surprisingly fell in November from October. It should be stronger in December.
It seems like Super Saturday was really strong because the National Retail Federation’s survey from November 27th to December 5th showed 147.8 million people planned to shop on Super Saturday which was up from 134.3 million. As of early December, 86% of shoppers had begun shopping and 52% were done. In 2018, 88% had started and 58% were done. Fewer were done because of the late Thanksgiving. Shopping shifted to December. In October, consumers expected to spend an average of $1,047.83 on holiday shopping (November 1st to December 31st) which is 4% above last year. NRF predicted sales growth would be from 3.8% to 4.2%. The November retail sales report showed there was only 3.3% growth (seasonally adjusted). It was a bit low.
According to Mastercard SpendingPulse, total U.S. retail sales from November 1st to Christmas Eve were up 3.4% compared to 2018. Online sales were up 18.8% and brick and mortar sales were up 1.2%. Online had a 14.6% share of total sales. (SpendingPulse uses sales activity from Mastercard’s payment network and estimates cash and other forms of payments.)
Lower Incomes Doing Quite Well
In this section were will review three charts that show how well lower income people are doing. This is all about the rate of change of their wage growth and wage growth in relation to people with higher income. Low wage growth is never going to change the entire system of wealth inequality. It’s not fair to expect it to. Just because upper income people are doing well because of gains in asset prices doesn’t mean these low income wage gains aren’t important.
In the December consumer sentiment report, those in the top third of income had their sentiment improve 7.5% because of the rise in stocks. Those in the bottom 2/3rds had sentiment increase just 0.8%. Even with that divergence, the top tenth is closer to the bottom tenth than it was in the late 1990s as you can see from the chart below. Specifically, from 2017-2019 the average difference between the top tenth’s sentiment index and the bottom tenth was 20.2 points. From 1997-2000, the average difference between the 2 categories was 30.1. It’s good to see a favorable comparison with the best run of consumer sentiment since this survey started.
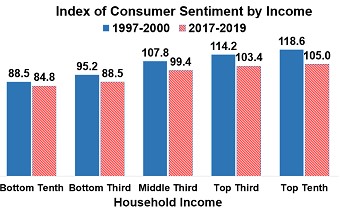
Source: University of Michigan
The Atlanta Fed wage growth tracker has great information on how workers of each income quartile have done. The 12 month moving average of wage growth in the first quartile (poorest) is 4.5% as of November 2019. That’s the joint highest wage growth since August 2008. Wage growth in 2008 was less important since many of these workers didn’t have jobs. The best period for these workers may have been the late 1990s when wage growth peaked at 7%. The great aspects about that wage growth is the labor market was full and inflation was low. In 1998, when wage growth peaked, CPI was only 1.55%. CPI has actually been higher than that this year. Keep in mind that it’s not bad to look worse than the best period for low income workers in many decades.
Currently, wage growth for the top quartile is only 2.9%. These workers are barely seeing any real wage growth, but they hardly notice because their stock investments are up almost 30% this year. In August 1998, the bottom quartile had 7% wage growth and the top had 4.5% growth. That’s a 2.5% difference which is more than the current 1.6% difference. As you can see from the chart below, the ratio of the lowest quartile to the median wage is above 0.55 which is the highest since at least 1997. Low income workers are doing really well. They love long expansions because these workers can be cast aside the easiest in times of economic strife.
Faster Wage Growth for the Lowest-Paid Workers https://t.co/Lx7oCRk33o pic.twitter.com/AHxbfuMKSD
— Jesse Felder (@jessefelder) December 16, 2019
The chart below shows the data slightly differently. It shows demographically adjusted average hourly earnings growth by wage tercile. This data is adjusted for age, sex, and race/ethnicity.
US wage growth is strongest at the bottom right now; at the top it's modestly decelerating. pic.twitter.com/xk1vzDQOkL
— Ernie Tedeschi (@ernietedeschi) December 22, 2019
The lowest tercile is doing much better than the middle and the highest. It’s notable that the last expansion never had a period where the lowest tercile did the best. This can have political ramifications. That was likely not a full cycle as it was ended prematurely due to the housing crash. Obviously, a huge decline in the consumer’s largest asset had more of an impact than a few years of wage growth.
It’s also notable than the periods where the bottom tercile does the best are very short lived. That’s because the labor market doesn’t stay full for long. With this already being such a long expansion, there’s hope this period where the bottom tercile outperforms can last longer than usual. There is pressure from progressives on monetary policy makers to keep rates low to keep the party going for low income workers. The obvious challenge is that inflation is a tax on the poor.
Conclusion
The latest sales results and survey data on consumer spending in December look great. It seems like December retail sales and PCE growth should be strong especially since sales shifted from November. The labor market has provided amazing wage growth to low income workers because of how tight it is. This has been the longest stretch of monthly job creation ever. This is probably the 2nd best period for low income workers in many decades (the best was the late 1990s).
Disclaimer: Please familiarize yourself with our full disclaimer here.


