
Company Price Change Announcements And Future Inflation
Goldman Sachs (Walker, “Company Pricing Announcements and the Inflation Outlook”) points out that changes in company statements regarding price changes is contemporaneously correlated with PCE inflation, but not predictive. This puts in a different perspective media discussion of impending inflation.
The below is Exhibit 2 from their report:
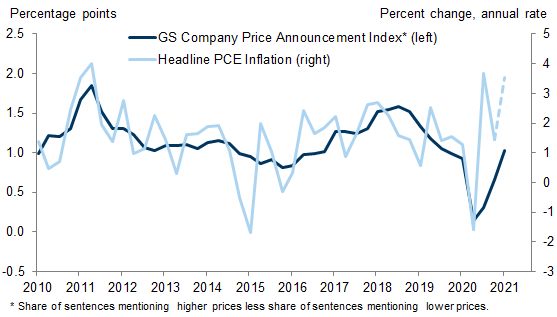
Source: Walker, “Company Pricing Announcements and the Inflation Outlook,” Goldman-Sachs, April 16, 2021.
The index is a proprietary one, based on text analysis of company earnings calls for Russell 3000 firms. They find:
…the relationship between price commentary and measured inflation appears to be mostly contemporaneous rather than leading, even though companies sometimes talk about future price changes. …after controlling for core inflation or other official measures of the underlying trend inflation, producer price inflation, wage growth, or oil prices, the incremental value of company price announcements for predicting inflation is significantly reduced.
GS notes that the index of price commentary has returned to, but not exceeded pre-pandemic levels.
For a discussion of price stickiness as measured by changes in items in the CPI, see this article by Nakamura/Steinsson (required reading in my macro course).
Is there anything to be gleaned from other measures? Some people pay attention to the sticky price CPI inflation rate. From Bryan/Mayer (Cleveland Fed):
We found that the flexible-price series tends to bounce violently from month to month, presumably as it responds to changing market conditions, including the degree of economic slack. On the other hand, sticky prices are, well, sticky, slow to adjust to economic conditions. Importantly, the sticky-price measure seems to contain a component of inflation expectations, and that component may be useful when trying to discern where inflation is heading.
Here’s a comparison of the CPI-all and sticky-price CPI inflation rates over the past two years.
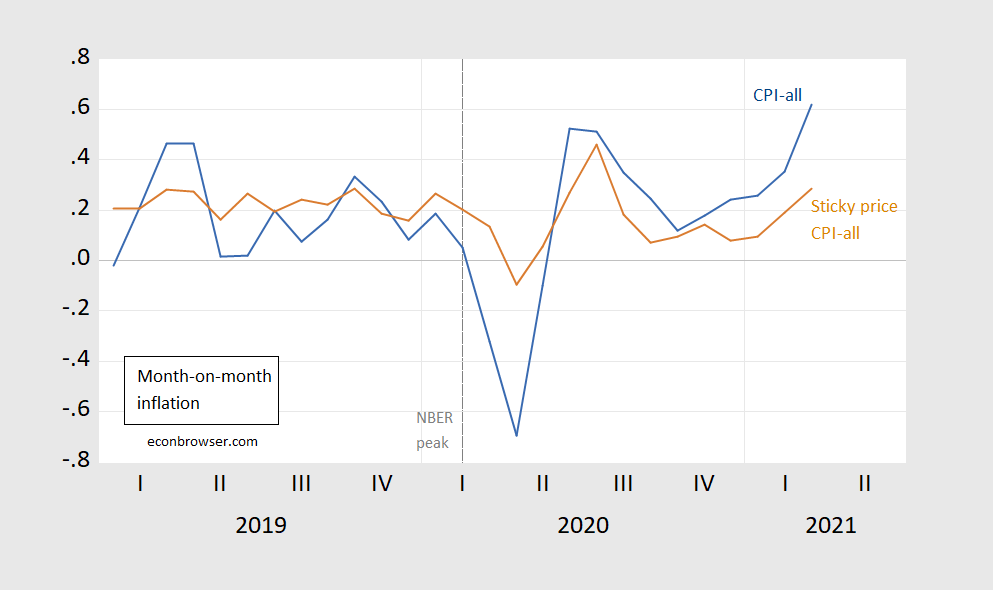
Figure 1: CPI all urban inflation (blue), CPI all urban sticky price inflation (brown), all month-on-month seasonally adjusted, NOT annualized, in percentage points. NBER peak data at the dashed line (2020M02). Source: BLS, Atlanta Fed via FRED.
Aside from the spike in 2020M07, the sticky price series looks unremarkable.
Finally, it’s of interest to see what the 5-year inflation breakeven looks like (even if it is a mismeasurement of the desired series).

Figure 2. Five-year inflation breakeven calculated as five-year Treasury yield minus five-year TIPS yield (blue), five-year breakeven adjusted by term premium and liquidity premium per DKW, all in %. Red dashed line at 4/13, CPI release date. Source: FRB via FRED, KWW following D’amico, Kim and Wei (DKW), and author’s calculations.
As discussed a couple of days ago, there was surprisingly little change to the inflation breakeven, although it must be restated that we would prefer to term and liquidity premium adjusted measure.
Disclosure: None.


