
XAU/USD: Markets Unmoved By US GDP Strength

Photo by Dmitry Demidko on Unsplash
At first glance, the US economy’s sharp acceleration in Q3 - with GDP growth exceeding 4% year-on-year - appears to decisively counter narratives of an economic slowdown. Yet the muted reaction in bond markets tells a different story. Yields have barely budged, and the yield curve continues to flatten in a pattern consistent with a “bull steepening” environment.
It seems strong growth figures are being largely dismissed. This is not the first time in recent years that robust GDP data have failed to impress the market. The explanation lies in the composition of growth. A significant portion stemmed from distortions in foreign trade: after a surge in imports earlier this year - driven by front-loaded demand ahead of anticipated tariffs - a subsequent sharp decline mechanically boosted GDP in Q2 and Q3.
Furthermore, it is worth noting that nearly 50% of private consumption is attributed to the top 10% of households, highlighting the uneven nature of domestic demand.
When adjusted for these temporary and structural factors, underlying growth appears far more moderate - closer to 2–2.5%. Key indicators such as income, employment, and business investment outside select AI-related projects do not support an “overheated” economy. This helps explain sustained investor interest in gold, particularly with inflation metrics still hovering above the Federal Reserve’s target.
Technical Analysis: XAU/USD
H4 Chart:
(Click on image to enlarge)
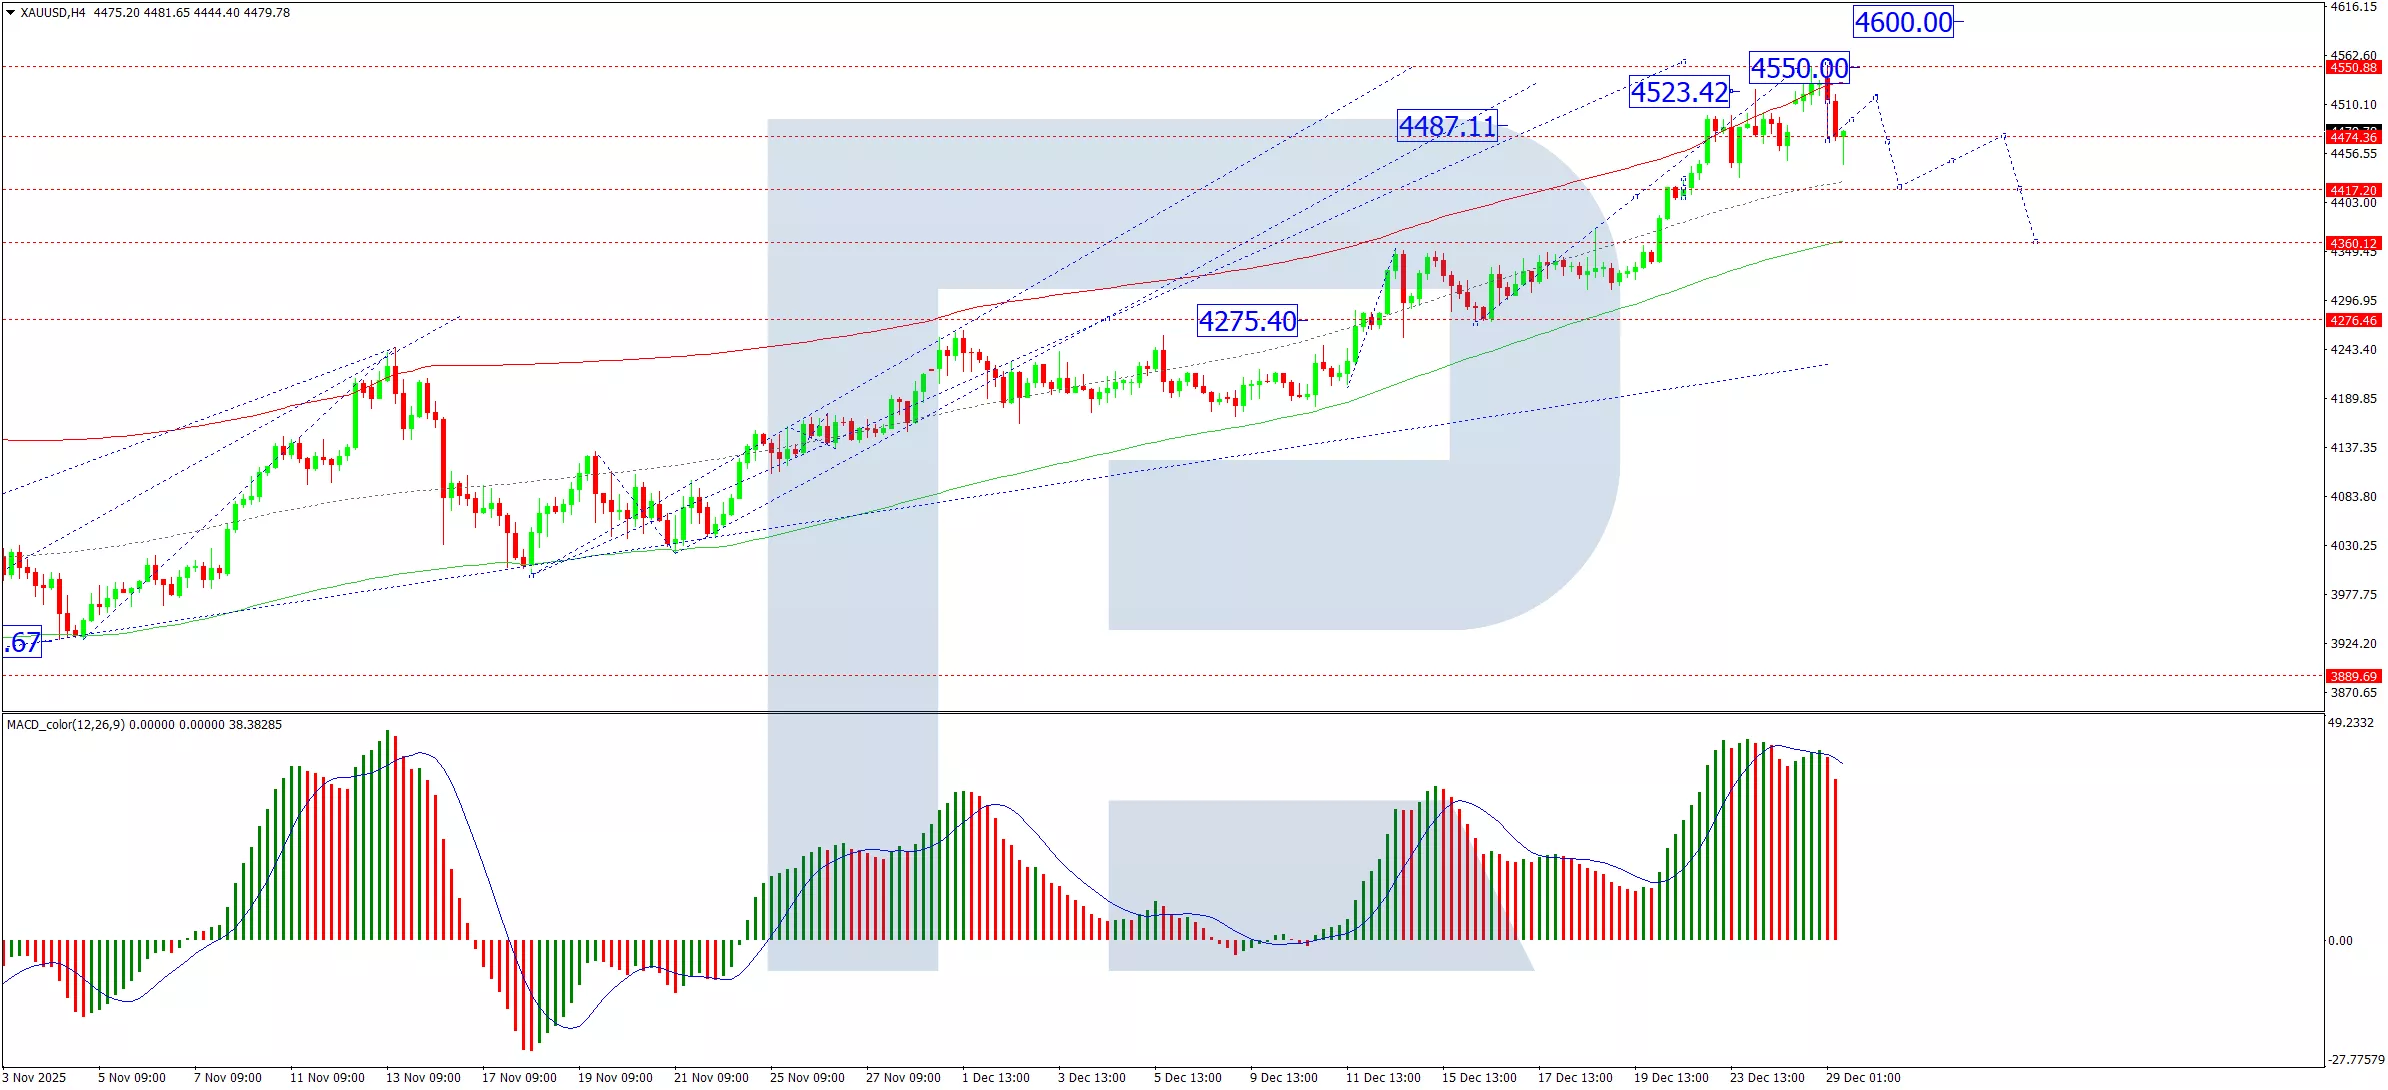
On the H4 chart, XAU/USD completed a fifth-wave advance to 4,550 USD, followed by a downward impulse to 4,474 USD and a corrective bounce to 4,525 USD. The market is now forming another bearish impulse toward 4,422 USD. A subsequent corrective rebound to retest 4,474 USD from below is anticipated, before a potential decline toward 4,360 USD.
The MACD indicator supports this near-term bearish outlook, with its signal line at elevated levels above zero but beginning to turn lower.
H1 Chart:
(Click on image to enlarge)
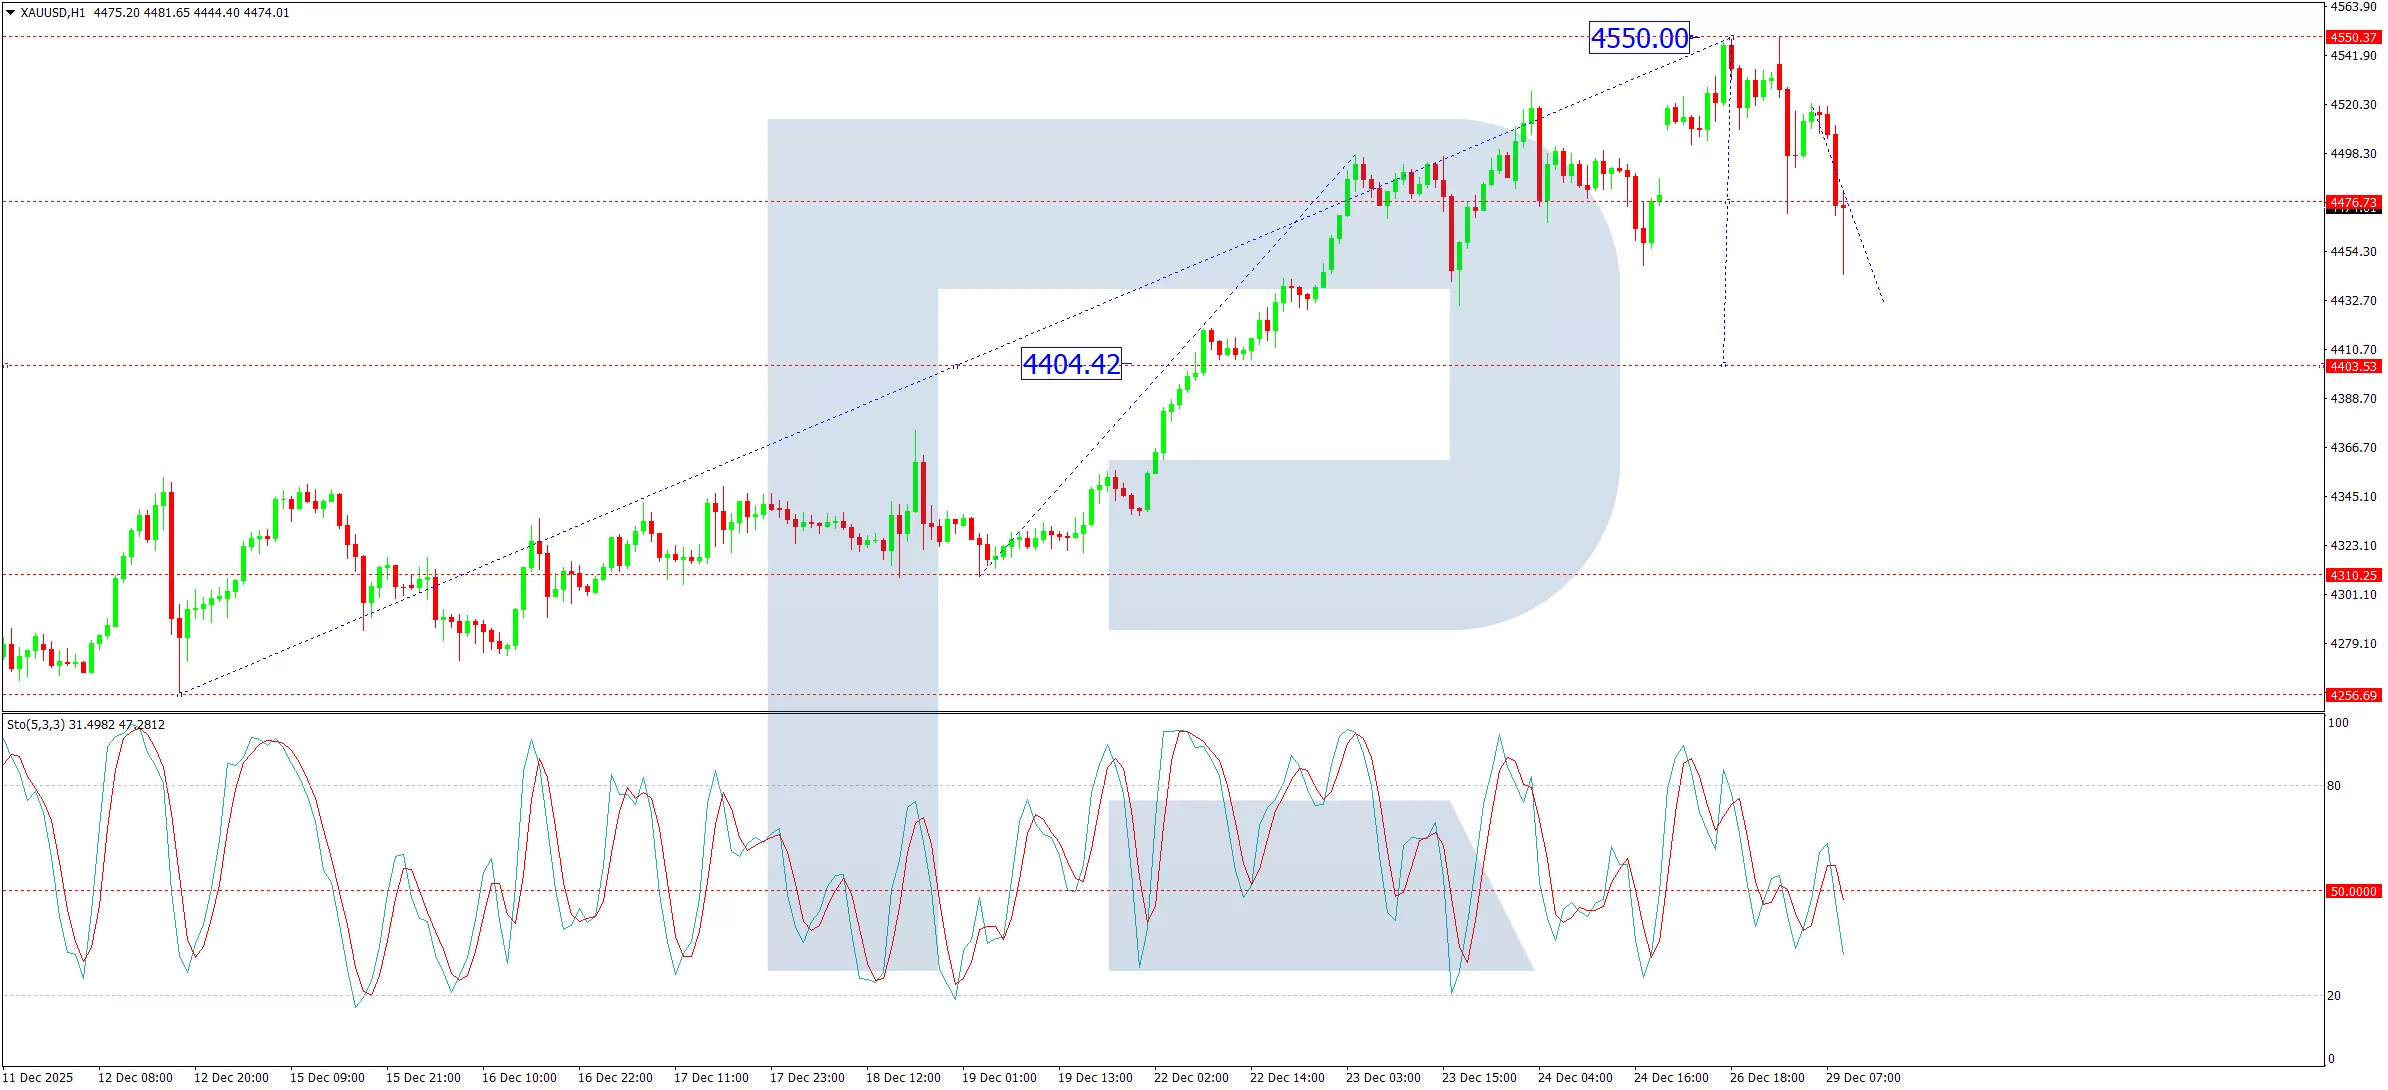
On the H1 chart, the pair broke below 4,474 USD and has consolidated around this level. A resumption of the decline is expected toward 4,432 USD, where some profit-taking could prompt a corrective rebound back toward 4,474 USD. Once complete, downward momentum is likely to resume, targeting 4,404 USD.
The Stochastic oscillator aligns with this view, with its signal line below 50 and descending toward 20, reflecting persistent selling pressure.
Conclusion
Gold’s resilience in the face of ostensibly strong US growth figures underscores investor skepticism about the sustainability and breadth of the economic expansion. With underlying momentum appearing more modest and inflation still elevated, demand for gold as a hedge remains intact. Technically, the metal is undergoing a corrective phase, with near-term targets near 4,422–4,404 USD. A deeper pullback toward 4,360 USD cannot be ruled out, though such a move may ultimately present a buying opportunity given the supportive macro backdrop.
More By This Author:
USD/JPY Bank Of Japan Hike Boosts Yen
GBP/USD: UK GDP Growth Matches Forecasts
EUR/USD: ECB Policy Stance Fails To Surprise Markets
Disclaimer: Any forecasts contained herein are based on the author's particular opinion. This analysis may not be treated as trading advice. RoboForex bears no responsibility for ...
more

