
XAU/USD: A Double Top Indicates The Buyers Are Losing Power
(Click on image to enlarge)
A Technical Correction or Momentum Shift?
In the long term, the XAU/USD is bullish but now performed a double top.
The price now is at a 6.5 years high, last time the price was in these zones was in April 2013.
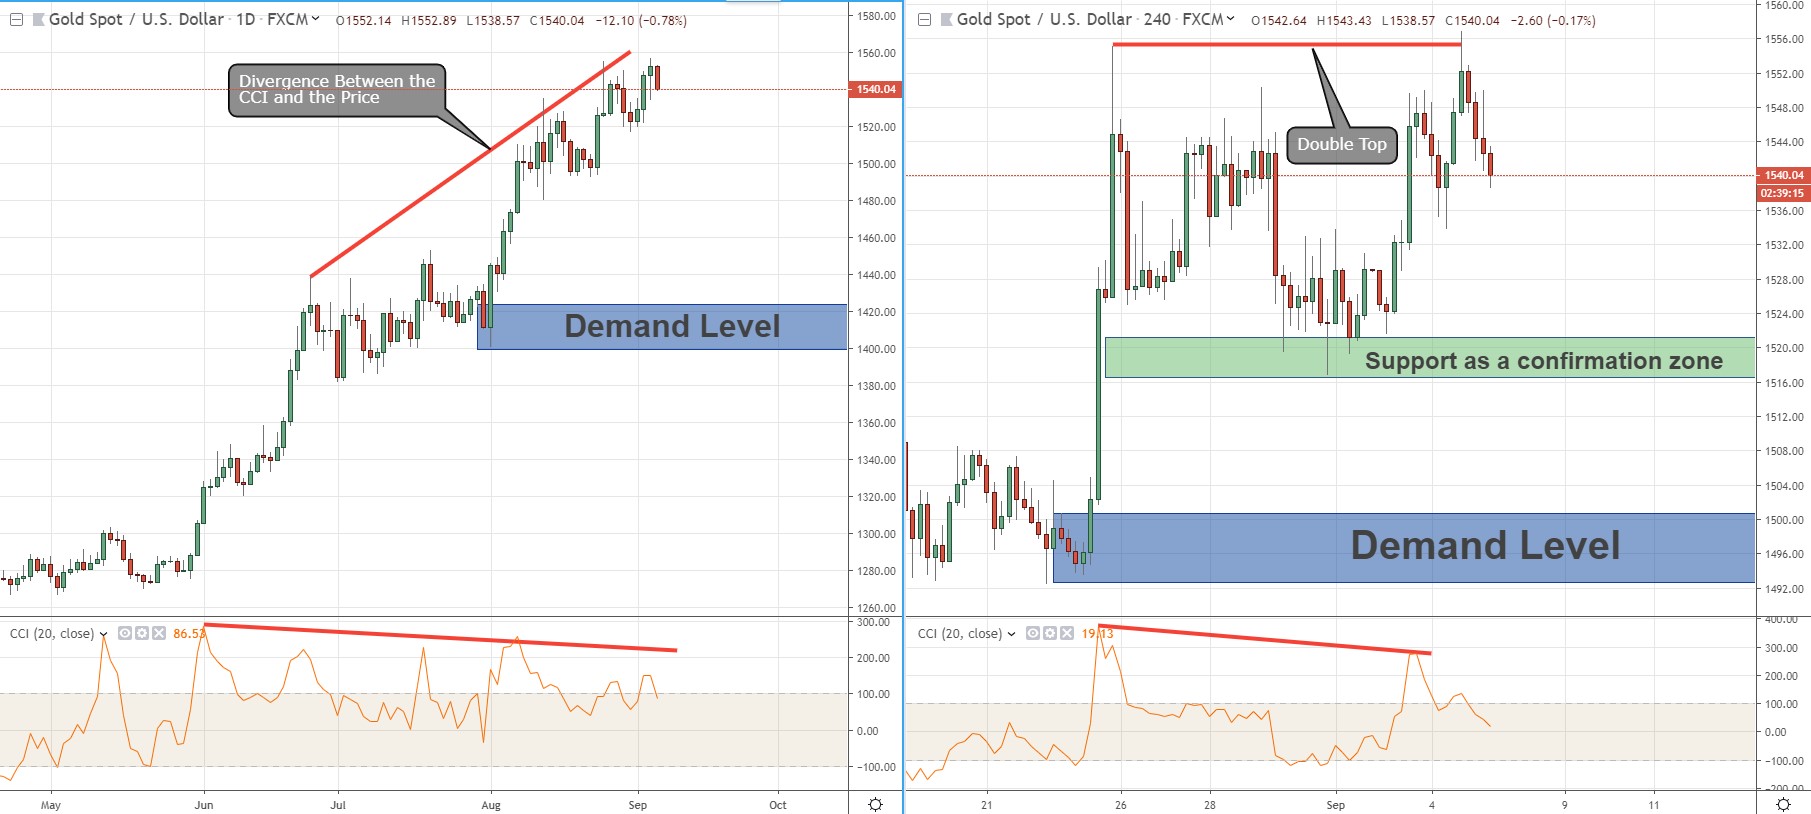
In the D1 time frame chart, we can see the nice rally the price performed.
We can see also a significant CCI divergence, while the price creates a higher high the CCI creates a lower high.
This divergence indicates that buyers start to lose power.
In the H4 time frame chart, we can see how the price starts to perform a double top which also indicates powerless buyers.
The price still hasn’t completed the double top pattern,
It will be completed only if the price will breakout the support below which is the confirmation zone.
In addition to theses 2 signals, if we look at the W1 chart we will see the price reach a significant supply from April 2013.
It is the first time the price touch this zone since then.
So, we have a CCI divergence in the D1 chart, double top in H4 chart, and significant supply in the W1 chart.
The confluence of all these signals creates a very reliable setup to look for a sell position.
Now, I’ll wait to see if the price will breakout the support below and complete the double top pattern.
If that happens I’ll look for price action setup for sell position.
The first target will be the demand below on the H4 chart and the final target will the demand I marked on the D1 chart.
BTW, if the price will break through the demand in the H4 chart it indicates that the long term momentum has changed to bearish.
As long as the price didn’t break the demand in the H4 chart it considers as a technical correction.


