
WTI Crude Oil Price Outlook: Pullback To Support, Can Bulls Hold?
CRUDE OIL PRICES BOUNCE
Crude oil prices have continued to show recovery so far in Q3, and this follows a bearish first couple of days to the fresh quarter after sellers posed a reaction at a very key resistance level. That resistance zone runs around the 60 psychological level, and this came into play in the last week of June while helping to hold the highs through the July open. After a quick bearish move stopped short of crossing the 56 level, buyers came back, helping to elicit a topside push back-above that vaulted area of 60 on the charts and soon creating a fresh seven-week-high.
Yesterday’s fresh seven-week-high has so far taken pause at a Fibonacci level of interest, as the price of 60.89 is the 23.6% retracement of the December-April major move.
WTI CRUDE OIL FOUR-HOUR PRICE CHART
(Click on image to enlarge)
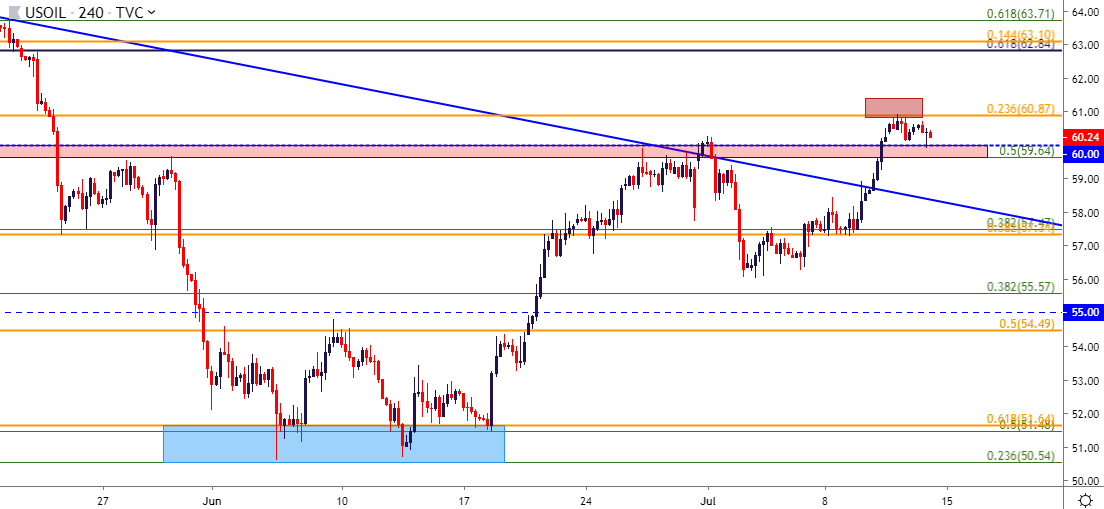
Chart prepared by James Stanley
STRENGTH DRIVEN BY SUPPLY FEARS WITH BREWING STORM IN THE GULF OF MEXICO
At the source of this recent bullish move has been a threatening weather formation brewing in the Gulf of Mexico. This week saw producers in the area cut production by more than one million barrels per day, or more than 53% of their output as Tropical Storm Barry bears down on the Louisiana coast. The storm is expected to make landfall on Saturday, which could further constrain production through next week, and this presents somewhat of a wild card to oil traders as it’s not yet possible to know just how much further disruption may be in the cards. Prospects for continued topside in crude oil prices appears to be at least somewhat linked to how aggressively this storm comes in.
From a technical perspective – the big question is whether that prior zone of resistance around the 60-handle can hold as support. This zone runs from the Fibonacci level at 59.64 up to the 60 level, and a hold of support here through next week’s open could keep the door open for short-term bullish strategies targeting the confluent zone that runs from 62.84-63.10.
WTI CRUDE OIL EIGHT HOUR PRICE CHART
(Click on image to enlarge)
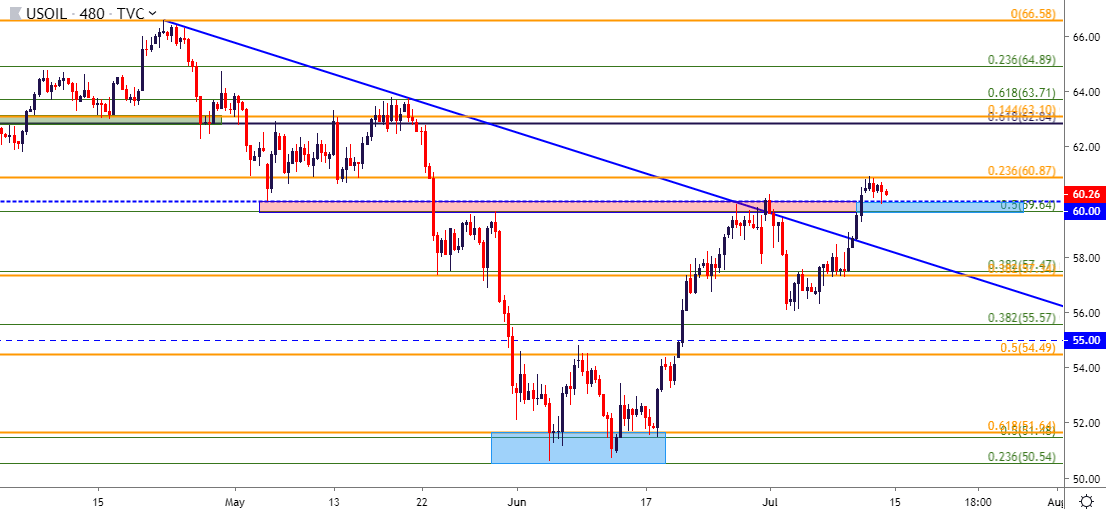
Chart prepared by James Stanley
CRUDE OIL – BEARISH STRATEGIES
Ahead of the July ramp, crude oil prices continued to trade with a bearish overtone. Even an extension of production cuts combined with a flare of geopolitical tensions between the US and Iran were unable to push prices above the 60-handle. It wasn’t until news of the brewing storm came into play that bulls got back in-charge to push prices up to a fresh high.
This presents a fairly interesting backdrop for short-side swing setups, particularly if the damage from the oncoming storm passes without creating much further complication with Gulf production. Today’s non-completed daily bar is showing as a doji following two days of strength; and given that this doji comes in with respect of the Fibonacci resistance looked at above, the door can remain open for bearish setups in crude oil. For additional confirmation, traders can look for a bearish move on Monday, which could create an evening star pattern on the chart. Prices pushing back-below the 59.64 level after next week’s open will help to fill that formation in, and that can re-open the door to short-side targets around the 57.50 and 55 levels on the chart.
WTI CRUDE OIL DAILY PRICE CHART
(Click on image to enlarge)
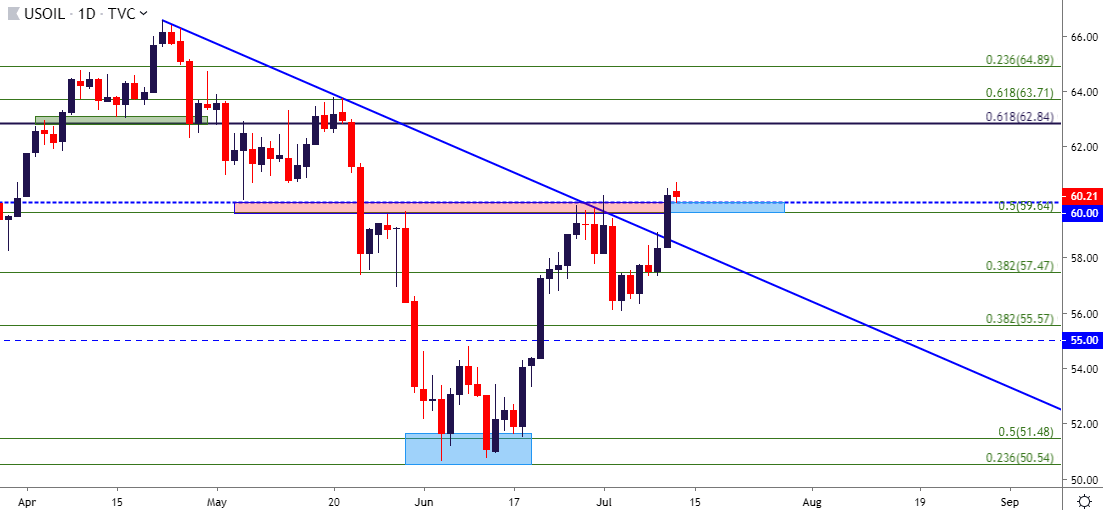
Chart prepared by James Stanley


