
WTI Crude Oil Eases Despite Supply Constraints, Brent Follows

OIL PRICES REPORT DOUBLE-DIGIT LOSSES - UKRAINE REMAINS OPEN TO ‘DIPLOMATIC SOLUTION’
At the time of writing, WTI and Brent Crude oil prices have declined by over 10% in today’s trading session, overshadowing fears of further supply constraints and rising energy prices. Following the ban on Russian oil by the US and UK, hopes of increased oil production and comments stating Ukraine remains open to a ‘diplomatic solution’ added a glimmer of hope to risk sentiment, allowing fears of higher inflation and energy costs to temporarily ease.
After ripping through channel resistance at the beginning of the month, US crude (WTI) and Brent Crude oil have fallen back to critical support, formed by key Fibonacci levels of historical moves.
However, as prices remain vulnerable to the global economic backdrop, heightened volatility and geopolitical tensions will likely continue to assist in the catalyzation of price action.
US CRUDE (WTI) OIL TECHNICAL ANALYSIS
After rising above 2014 high, currently providing support at 107.65, WTI continued to surge before running into a wall of resistance at the key psychological level of $130.00. However, failure for bulls to gain traction above this level allowed sellers to temporarily step in and drive prices back below the 78.6% retracement of the historical move (2008 – 2020) at around the 115.77 in an effort to drive prices back below the $100.00 mark.
US CRUDE OIL (WTI) DAILY CHART
(Click on image to enlarge)
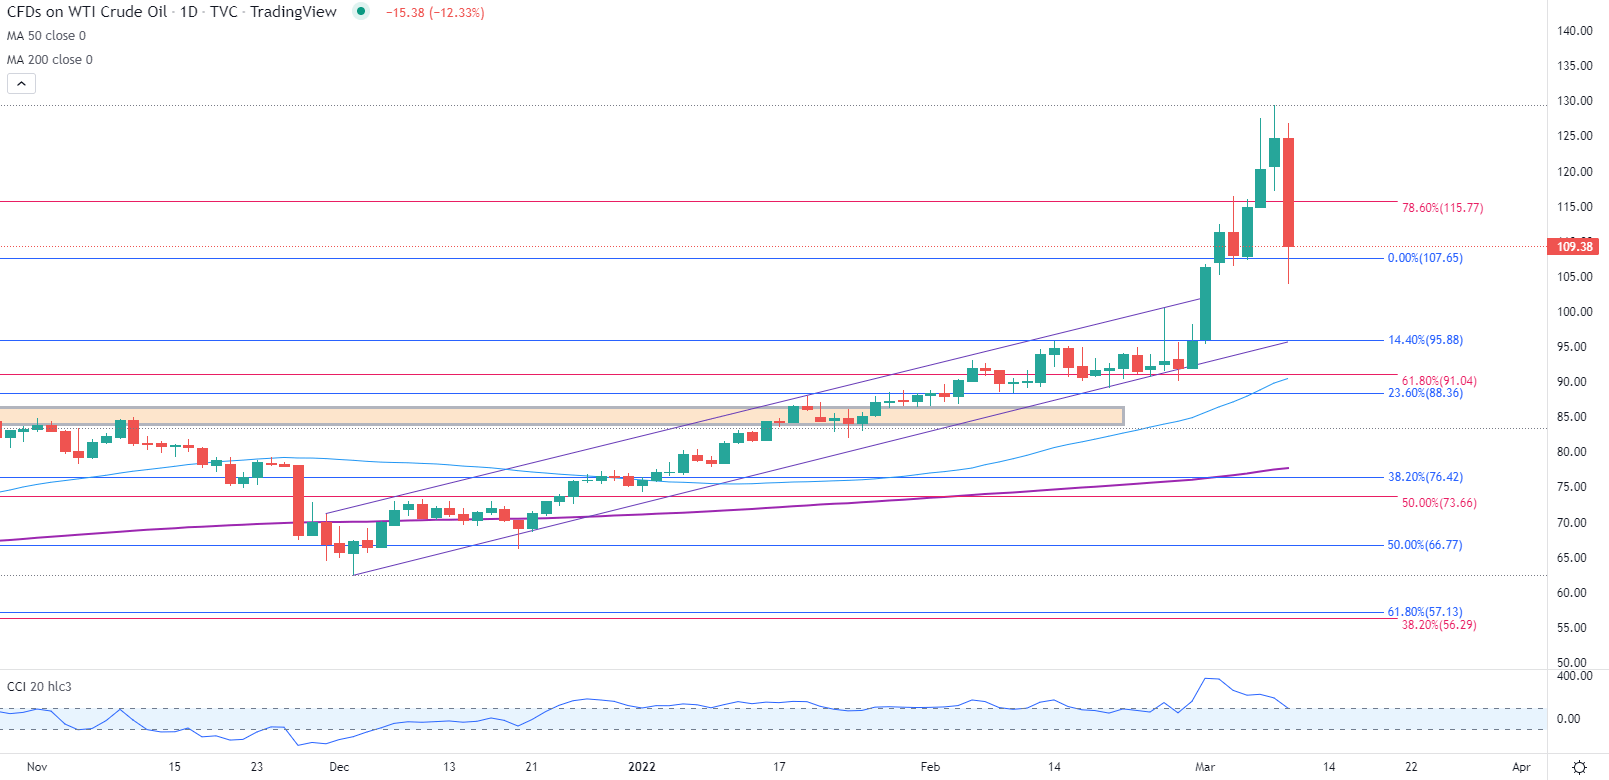
Chart prepared by Tammy Da Costa using TradingView
BRENT CRUDE TECHNICAL ANALYSIS
Likewise, Brent crude has fallen from back below the 78.6% retracement, prior support, turned resistance with the next layer of support holding at $100. As the CCI (commodity channel index) continues to threaten overbought territory, bears will need to drive prices back below the 97.37 handle and through the upper bounds of channel resistance for the bearish trend to persist.
BRENT CRUDE DAILY CHART
(Click on image to enlarge)
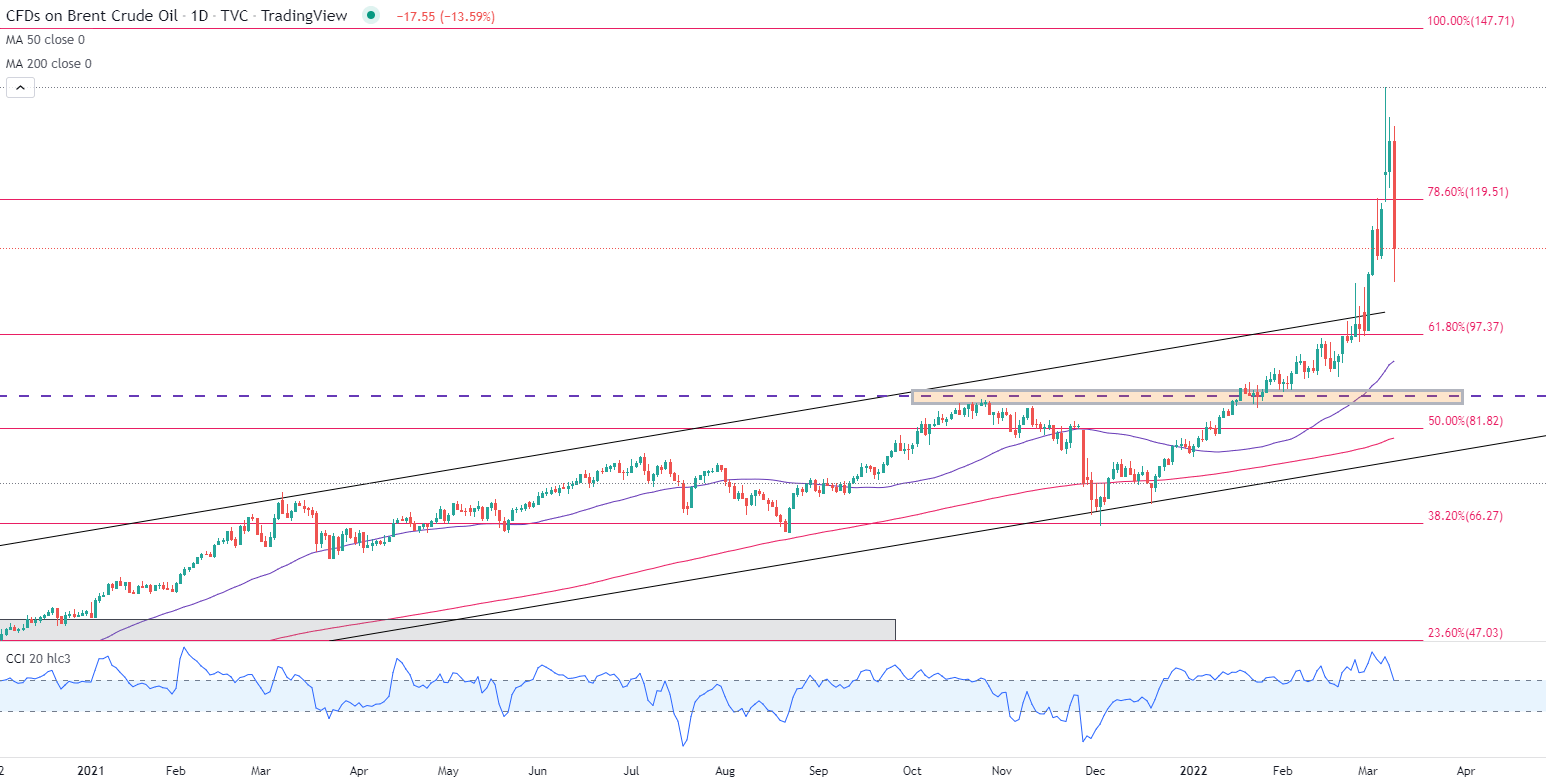
Chart prepared by Tammy Da Costa using TradingView
Disclosure: See the full disclosure for DailyFX here.

Comments
 No Thumbs up yet!

