
Will Gold Chart New Lows As USD Rises?
As the silver craze subsides and the USD rises - partly due to a better-than-expected U.S. jobless report - gold and the precious metals will be testing deeper waters.
While silver stole the spotlight recently, I’ve been emphasizing the importance of what’s happening in the USD Index and gold. Developments in both markets had bearish implications for the precious metals market overall, and we didn’t have to wait long for the results.
Namely, gold moved lower once again in today’s pre-market trading and it’s currently testing its 2021 lows.
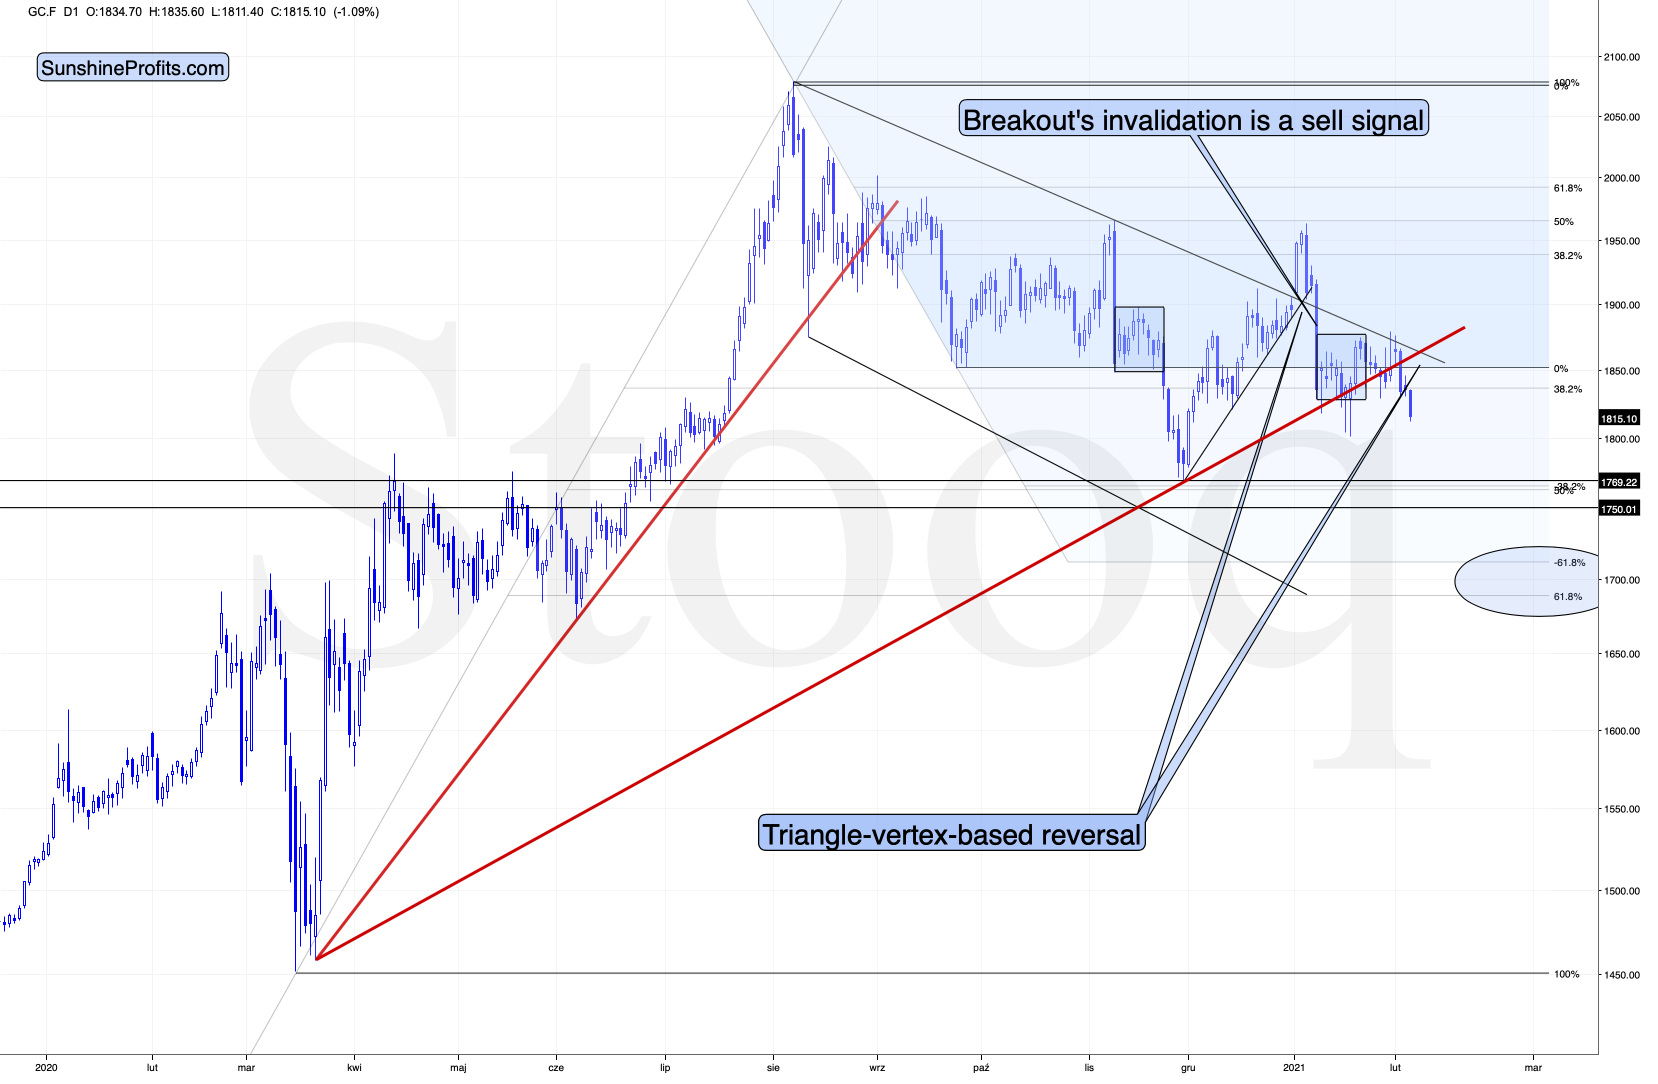
Figure 1
In Tuesday's analysis, I wrote that the yellow metal’s breakdown below the rising red support line was not yet confirmed, but that the situation had already become more bearish. Gold closed below this line for the second day yesterday and given today’s decline, it seems that it’s going to close below it for the third consecutive day. This means that the breakdown is almost confirmed, and the implications are strongly bearish.
Now, given the proximity of the triangle-vertex-based reversal, I wouldn’t rule out a quick comeback and then another downturn within the next several days.
Theoretically, it’s possible that gold slides to $1,700 shortly and reverses there, but we wouldn’t bet the farm on this happening this or the next week. However, it is very likely to take place in February (more likely) or in March (less likely).
Why is this move likely to happen soon? Because of what happened in the USD Index.
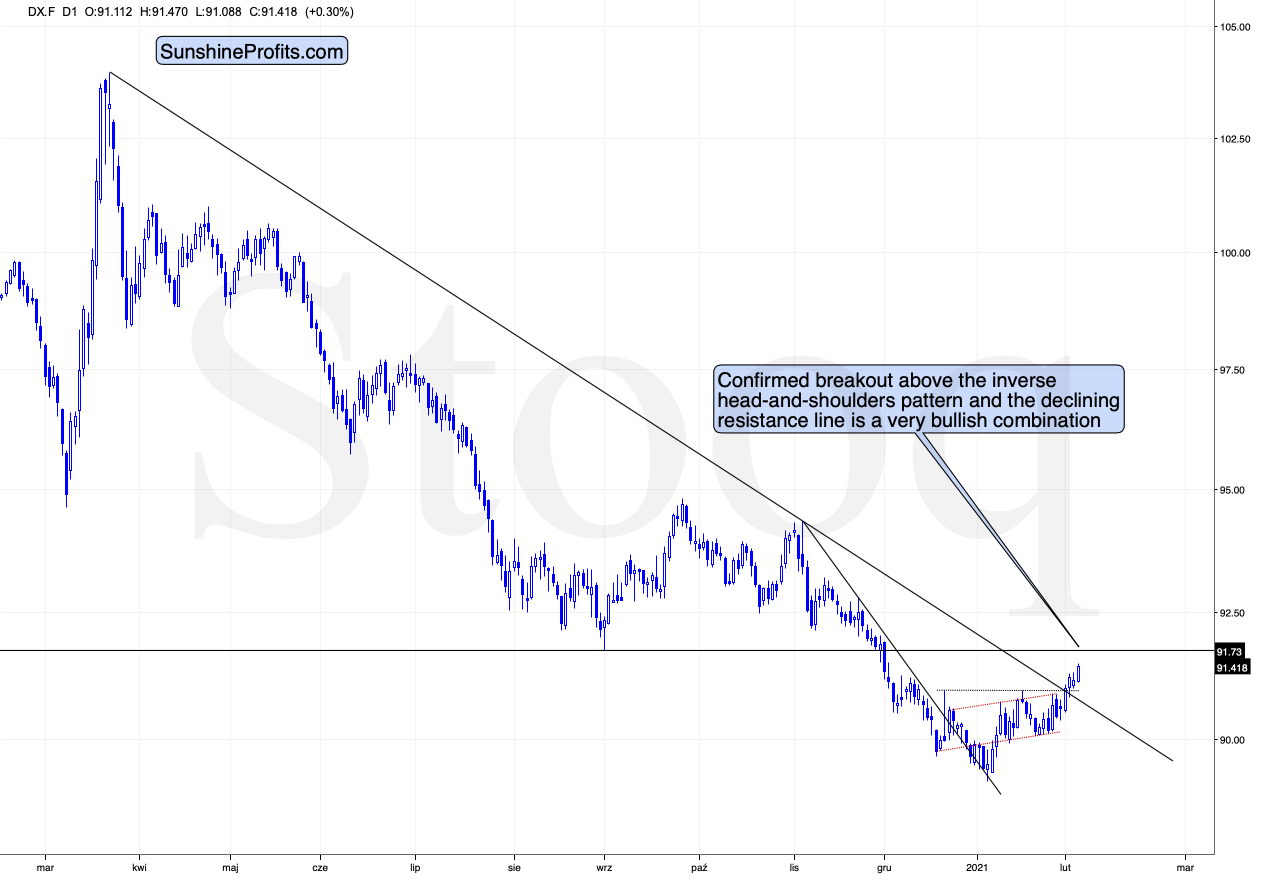
Figure 2
The U.S. currency just confirmed two important breakouts:
- Breakout above the neck level of the inverse head-and-shoulders pattern
- Breakout above the declining medium-term resistance line based on the March 2020 and November 2020 highs.
The above is important also due to another – even more critical – reason.
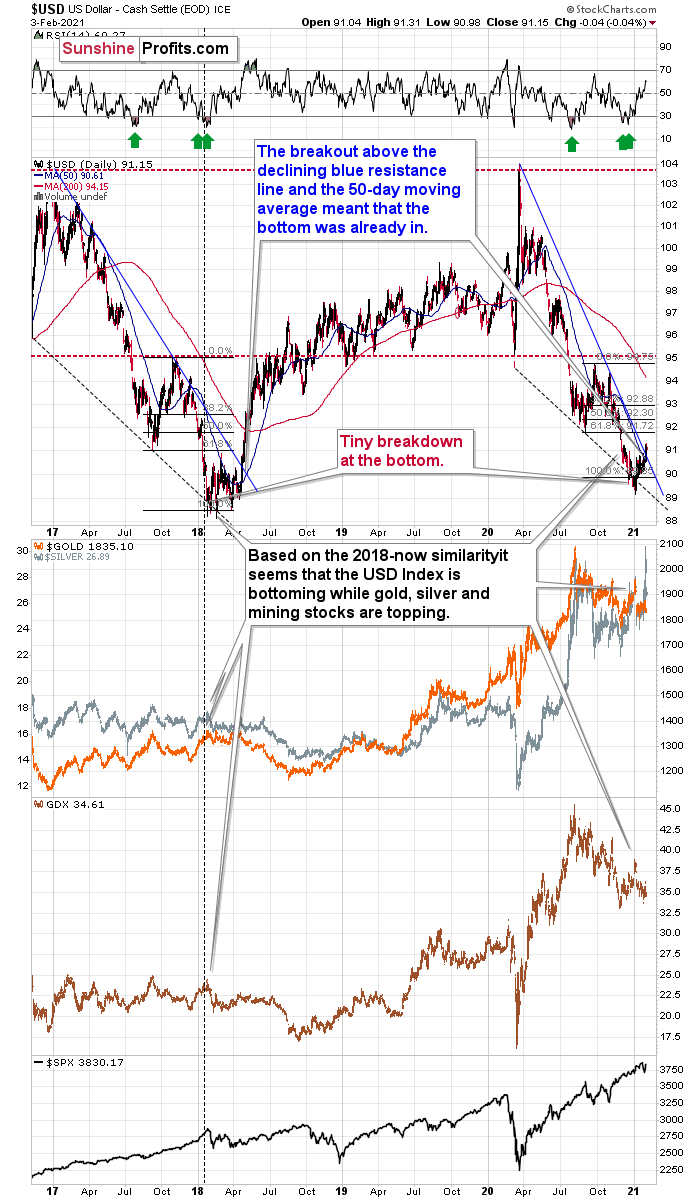
Figure 3
Based on the remarkable similarity to early 2018 (also in bitcoin and dogecoin, and most likely also in stocks to some extent), the breakout above the declining resistance line (and the 50-day moving average) is likely to mark the start of a big, sharp upswing.
Back in 2018, the rally continued until the USD Index moved to its previous medium-term high. Afterward, it started to move in a more moderate manner.
If the history rhymes once again (the similarity has been uncanny in the previous months), then the next temporary stop for the USD Index is a bit below 95, as that’s when the USDX topped in September 2020. Precisely, that was 94.80, so to be conservative, we can say that the next particularly significant resistance for the USD Index is at about 94.5.
Will this level correspond to gold at $1,700? This might be the case, but it could also be the case that gold declines to $1,700 even sooner. Given the current gold-USD dynamics, I don’t expect to see the USD Index at about 95 without seeing gold decline to at least $1,700.
Disclaimer: All essays, research, and information found on the Website represent the analyses and opinions of Mr. Radomski and Sunshine Profits' associates only. As such, it may prove wrong ...
more

