
Why Stimulus Can’t Fix Our Energy Problems
Economists tell us that within the economy there is a lot of substitutability, and they are correct. However, there are a couple of not-so-minor details that they overlook:
- There is no substitute for energy. It is possible to harness energy from another source or to make a particular object run more efficiently, but the laws of physics prevent us from substituting something else for energy. Energy is required whenever physical changes are made, such as when an object is moved, or material is heated, or electricity is produced.
- Supplemental energy leverages human energy. The reason why the human population is as high as it is today is because pre-humans long ago started learning how to leverage their human energy (available from digesting food) with energy from other sources. Energy from burning biomass was first used over one million years ago. Other types of energy, such as harnessing the energy of animals and capturing wind energy with sails of boats, began to be used later. If we cut back on our total energy consumption in any material way, humans will lose their advantage over other species. Population will likely plummet because of epidemics and fighting over scarce resources.
Many people appear to believe that stimulus programs by governments and central banks can substitute for growth in energy consumption. Others are convinced that efficiency gains can substitute for growing energy consumption. My analysis indicates that workarounds, in the aggregate, don’t keep energy prices high enough for energy producers. Oil prices are at risk, but so are coal and natural gas prices. We end up with a different energy problem than most have expected: energy prices that remain too low for producers. Such a problem can have severe consequences.
Let’s look at a few of the issues involved:
[1] Despite all of the progress being made in reducing birth rates around the globe, the world’s population continues to grow, year after year.

Figure 1. 2019 World Population Estimates of the United Nations. Source: https://population.un.org/wpp/Download/Standard/Population/
Advanced economies, in particular, have been reducing birth rates for many years. But despite these lower birthrates, world population continues to rise because of the offsetting impact of increasing life expectancy. The UN estimates that in 2018, world population grew by 1.1%.
[2] This growing world population leads to growing use of natural resources of every kind.
There are three reasons we might expect growing use of material resources:
(a) The growing world population in Figure 1 needs food, clothing, homes, schools, roads and other goods and services. All of these needs lead to the use of more resources of many different types.
(b) The world economy needs to work around the problems of an increasingly resource-constrained world. Deeper wells and more desalination are required to handle the water needs of a rising population. More intensive agriculture (with more irrigation, fertilization, and pest control) is needed to harvest more food from essentially the same number of arable acres. Metal ores are increasingly depleted, requiring more soil to be moved to extract the ore needed to maintain the use of metals and other minerals. All of these workarounds to accommodate a higher population relative to base resources are likely to add to the economy’s material resource requirements.
(c) Energy products themselves are also subject to limits. Greater energy use is required to extract, process, and transport energy products, leading to higher costs and lower net available quantities.
Somewhat offsetting these rising resource requirements is the inventiveness of humans and the resulting gradual improvements in technology over time.
What does actual resource use look like? UN data summarized by MaterialFlows.net shows that extraction of world material resources does indeed increase most years.

Figure 2. World total extraction of physical materials used by the world economy, calculated using weight in metric tons. Chart is by MaterialFlows.net. Amounts shown are based on the Global Material Flows Database of the UN International Resource Panel. Non-metallic minerals include many types of materials including sand, gravel, and stone, as well as minerals such as salt, gypsum, and lithium.
[3] The years during which the quantities of material resources cease to grow correspond almost precisely to recessionary years.
If we examine Figure 2, we see flat periods or periods of actual decline at the following points: 1974-75, 1980-1982, 1991, and 2008-2009. These points match up almost exactly with US recessionary periods since 1970:

Figure 3. Dates of US recessions since 1970, as graphed by the Federal Reserve of St. Louis.
The one recessionary period that is missed by the Figure 2 flat periods is the brief recession that occurred about 2001.
[4] World energy consumption (Figure 4) follows a very similar pattern to world resource extraction (Figure 2).

Figure 4. World Energy Consumption by fuel through 2018, based on 2019 BP Statistical Review of World Energy. Quantities are measured in energy equivalence. “Other Renew” includes a number of kinds of renewables, including wind, solar, geothermal, and sawdust burned to provide electricity. Biofuels such as ethanol are included in “Oil.”
Note that the flat periods are almost identical to the flat periods in the extraction of material resources in Figure 2. This is what we would expect, if it takes material resources to make goods and services, and the laws of physics require that energy consumption be used to enable the physical transformations required for these goods and services.
[5] The world economy seems to need an annual growth in world energy consumption of at least 2% per year, to stay away from recession.
There are really two parts to projecting how much energy consumption is needed:
- How much growth in energy consumption is required to keep up with growing population?
- How much growth in energy consumption is required to keep up with the other needs of a growing economy?
Regarding the first item, if the population growth rate continues at a rate similar to the recent past (or slightly lower), about 1% growth in energy consumption is needed to match population growth.
To estimate how much growth in energy supply is needed to keep up with the other needs of a growing economy, we can look at per capita historical relationships:

Figure 5. Three-year average growth rates of energy consumption and GDP. Energy consumption growth per capita uses amounts provided in BP 2019 Statistical Review of World Energy. World per capita GDP amounts are from the World Bank, using GDP on a 2010 US$ basis.
The average world per capita energy consumption growth rate in non-recessionary periods varies as follows:
- All years: 1.5% per year
- 1970 to present: 1.3% per year
- 1983 to present: 1.0% per year
Let’s take 1.0% per year as the minimum growth in energy consumption per capita required to keep the economy functioning normally.
If we add this 1% to the 1% per year expected to support continued population growth, the total growth in energy consumption required to keep the economy growing normally is about 2% per year.
Actual reported GDP growth would be expected to be higher than 2%. This occurs because the red line (GDP) is higher than the blue line (energy consumption) on Figure 5. We might estimate the difference to be about 1%. Adding this 1% to the 2% above, total reported world GDP would be expected to be about 3% in a non-recessionary environment.
There are several reasons why reported GDP might be higher than energy consumption growth in Figure 5:
- A shift to more of a service economy, using less energy in proportion to GDP growth
- Efficiency gains, based on technological changes
- Possible intentional overstatement of reported GDP amounts by some countries to help their countries qualify for loans or to otherwise enhance their status
- Intentional or unintentional understatement of inflation rates by reporting countries
[6] In the years subsequent to 2011, growth in world energy consumption has fallen behind the 2% per year growth rate required to avoid recession.
Figure 6 shows the extent to which energy consumption growth has fallen behind a target growth rate of 2% since 2011.

Figure 6. Indicated amounts to provide 2% annual growth in energy consumption, as well as actual increases in world energy consumption since 2011. Deficit is calculated as Actual minus Required at 2%. Historical amounts from BP 2019 Statistical Review of World Energy.
[7] The growth rates of oil, coal and nuclear have all slowed to below 2% per year since 2011. While the consumption of natural gas, hydroelectric and other renewables is still growing faster than 2% per year, their surplus growth is less than the deficit of oil, coal and nuclear.
Oil, coal, and nuclear are the types of energy whose growth has lagged below 2% since 2011.
![]()
Figure 7. Oil, coal, and nuclear growth rates have lagged behind the target 2% growth rate. Amounts based on data from BP’s 2019 Statistical Review of World Energy.
The situations behind these lagging growth rates vary:
- Oil. The slowdown in world oil consumption began in 2005 when the price of oil spiked to the equivalent of $70 per barrel (in 2018$). The relatively higher cost of oil compared with other fuels since 2005 has encouraged conservation and the switching to other fuels.
- Coal. China, especially, has experienced lagging coal production since 2012. Production costs have risen because of depleted mines and more distant sources, but coal prices have not risen to match these higher costs. Worldwide, coal has pollution issues, encouraging a switch to other fuels.
- Nuclear. Growth has been low or negative since the Fukushima accident in 2011.
Figure 8 shows the types of world energy consumption that have been growing more rapidly than 2% per year since 2011.

Figure 8. Natural gas, hydroelectric, and other renewables (including wind and solar) have been growing more rapidly than 2% since 2011. Amounts based on data from BP’s 2019 Statistical Review of World Energy.
While these types of energy produce some surplus relative to an overall 2% growth rate, their total quantity is not high enough to offset the significant deficit generated by oil, coal, and nuclear.
Also, it is not certain how long the high growth rates for natural gas, hydroelectric, and other renewables can persist. The growth in natural gas may slow because transport costs are high, and consumers are not willing/able to pay for the high delivered cost of natural gas when distant sources are used. Hydroelectric encounters limits because most of the good sites for dams are already taken. Other renewables also encounter limits, partly because many of the best sites are already taken, and partly because batteries are needed for wind and solar, and there is a limit to how fast battery makers can expand production.
Putting the two groupings together, we obtain the same deficit found in Figure 6.
![]()
Figure 9. Comparison of extra energy over targeted 2% growth from natural gas, hydroelectric and other renewables with energy growth deficit from oil, coal and nuclear combined. Amounts based on data from BP’s 2019 Statistical Review of World Energy.
Based on the above discussion, it seems likely that energy consumption growth will tend to lag behind 2% per year for the foreseeable future.
[8] The economy needs to produce its own “demand” for energy products, in order to keep prices high enough for producers. When energy consumption growth is below 2% per year, the danger is that energy prices will fall below the level needed by energy producers.
Workers play a double role in the economy:
- They earn wages, based on their jobs, and
- They are the purchasers of goods and services.
In fact, low-wage workers (the workers that I sometimes call “non-elite workers”) are especially important, because of their large numbers and their role in buying many items that use significant amounts of energy. If these workers aren’t earning enough, they tend to cut back on their discretionary buying of homes, cars, air conditioners, and even meat. All of these require considerable energy in their production and in their use.
High-wage workers tend to spend their money differently. Most of them have already purchased as many homes and vehicles as they can use. They tend to spend their extra money differently–on services such as private education for their children, or on investments such as shares of stock.
An economy can be configured with “increased complexity” in order to save energy consumption and costs. Such increased complexity can be expected to include larger companies, more specialization, and more globalization. Such increased complexity is especially likely if energy prices rise, increasing the benefit of substitution away from the energy products. Increased complexity is also likely if stimulus programs provide inexpensive funds that can be used to buy out other firms and for the purchase of new equipment to replace workers.
The catch is that increased complexity tends to reduce demand for energy products because the new way the economy is configured tends to increase wage disparity. An increasing share of workers are replaced by machines or find themselves needing to compete with workers in low-wage countries, lowering their wages. These lower wages tend to lower the demand of non-elite workers.
If there is no increase in complexity, then the wages of non-elite workers can stay high. The use of growing energy supplies can lead to the use of more and better machines to help non-elite workers, and the benefit of those machines can flow back to non-elite workers in the form of higher wages, reflecting “higher worker productivity.” With the benefit of higher wages, non-elite workers can buy the energy-consuming items that they prefer. Demand stays high for finished goods and services. Indirectly, it also stays high for commodities used in the process of making these finished goods and services. Thus, prices of energy products can be as high as needed, so as to encourage production.
In fact, if we look at average annual inflation-adjusted oil prices, we find that 2011 (the base year in Sections [6] and [7]) had the single highest average price for oil.1 This is what we would expect if energy consumption growth had been adequate immediately preceding 2011.

Figure 10. Historical inflation-adjusted Brent-equivalent oil prices based on data from 2019 BP Statistical Review of World Energy.
If we think about the situation, it not surprising that the peak in average annual oil prices took place in 2011, and the decline in oil prices has coincided with the growing net deficit shown in Figures 6 and 9. There was really a double loss of demand, as growth in energy use slowed (reducing direct demand for energy products) and as complexity increased (shifting more of the demand to high-wage earners and away from the non-elite workers).
What is even more surprising is that fact that the prices of fuels, in general, tend to follow a similar pattern (Figure 11). This strongly suggests that demand is an important part of price setting for energy products of all kinds. People cannot buy more goods and services (made and transported with energy products) than they can afford over the long term.

Figure 11. Comparison of changes in oil prices with changes in other energy prices, based on time series of historical energy prices shown in BP’s 2019 Statistical Review of World Energy. The prices in this chart are not inflation-adjusted.
If a person looks at all of these charts (deficits in Figures 6 and 9 and oil and energy prices in general from Figures 10 and 11) for the period 2011 onward, there is a very distinct pattern. There is at first a slow slide down, then a fast slide down, followed (at the end) by an uptick. This is what we should expect if low energy growth is leading to low prices for energy products in general.
[9] There are two different ways that oil and other energy prices can damage the economy: (a) by rising too high for consumers or (b) by falling too low for producers to have funds for reinvestment, taxes, and other needs. The danger at this point is from (b), energy prices falling too low for producers.
Many people believe that the only energy problem that an economy can have is prices that are too high for consumers. In fact, energy prices seemed to be very high in the lead-ups to the 1974-1975 recession, the 1980-1982 recession, and the 2008-2009 recession. Figure 5 shows that the worldwide growth in energy consumption was very high in the lead-up to all three of these recessions. In the two earlier time periods, the US, Europe, and the Soviet Union were all growing their economies, leading to high demand. Preceding the 2008-2009 Great Recession, China was growing its economy very rapidly at the same time the US was providing low-interest rate rates for home purchases, some of them to subprime borrowers. Thus, demand was very high at that time.
The 1974-75 recession and the 1980-1982 recession were fixed by raising interest rates. The world economy was overheating with all of the increased leveraging of human energy with energy products. Higher short-term interest rates helped bring growth in energy prices (as well as food prices, which are very dependent on energy consumption) down to a more manageable level.

Figure 12. Three-month and ten-year interest rates through May 2019, in chart by Federal Reserve of St. Louis.
There was really a two-way interest rate fix related to the Great Recession of 2008-2009. First, when oil and other energy prices started to spike, the US Federal Reserve raised short term interest rates in the mid-2000s. This, by itself, was almost enough to cause recession. When recession started to set in, short-term interest rates were brought back down. Also, in late 2008, when oil prices were very low, the US began using Quantitative Easing to bring longer-term interest rates down, and the price of oil back up.
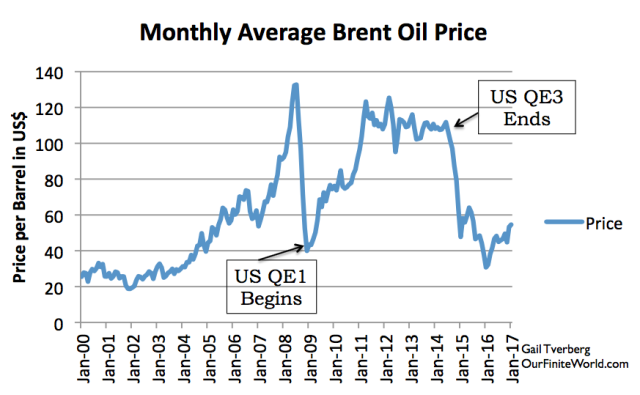
Figure 13. Monthly Brent oil prices with dates of US beginning and ending Quantitative Easing.
There is one recession that seems to have been the result of low oil prices, perhaps combined with other factors. That is the recession that was associated with the collapse of the central government of the Soviet Union in 1991.
[10] The recession that comes closest to the situation we seem to be heading into is the one that affected the world economy in 1991 and shortly thereafter.
If we look at Figures 2 and 5, we can see that the recession that occurred in 1991 had a moderately severe effect on the world economy. Looking back at what happened, this situation occurred when the central government of the Soviet Union collapsed after 10 years of low oil prices (1982-1991). With these low prices, the Soviet Union had not been earning enough to reinvest in new oil fields. Also, communism had proven to be a fairly inefficient method of operating the economy. The world’s self-organizing economy produced a situation in which the central government of the Soviet Union collapsed. The effect on resource consumption was very severe for the countries most involved with this collapse.

Figure 14. Total extraction of physical materials Eastern Europe, Caucasus, and Central Asia, in chart by MaterialFlows.net. Amounts shown are based on the Global Material Flows Database of the UN International Resource Panel.
World oil prices have been falling too low, at least since 2012. The biggest decreases in prices have come since 2014. With energy prices already very low compared to what producers need, there is a need right now for some type of stimulus. With interest rates as low as they are today, it will be very difficult to lower interest rates much further.
Also, as we have seen, debt-related stimulus of is not very effective at raising energy prices unless it actually raises energy consumption. What works much better is energy supply that is cheap and abundant enough that supply can be ramped up at a rate well in excess of 2% per year, to help support the growth of the economy. Suitable energy supply should be inexpensive enough to produce that it can be taxed heavily, in order to help support the rest of the economy.
Unfortunately, we cannot just walk away from economic growth because we have an economy that needs to continue to expand. One part of this need is related to the world’s population, which continues to grow. Another part of this need relates to the large amount of debt that needs to be repaid with interest. We know from recent history (as well as common sense) that when economic growth slows too much, repayment of debt with interest becomes a problem, especially for the most vulnerable borrowers. Economic growth is also needed if businesses are to receive the benefit of economies of scale. Ultimately, an expanding economy can be expected to benefit the price of a company’s stock.
Observations and Conclusions
Perhaps the best way of summing up how my model of the world economy differs from other ones is to compare it to popular other models.
The Peak Oil model says that our energy problem will be an oil supply problem. Some people believe that oil demand will rise endlessly, allowing prices to rise in a pattern following the ever-rising cost of extraction. In the view of Peak Oilers, a particular point of interest is the date when the supply of oil “peaks” and starts to decline. In the view of many, the price of oil will start to skyrocket at that point because of inadequate supply.
To their credit, Peak Oilers did understand that there was an energy bottleneck ahead, but they didn’t understand how it would work. While oil supply is an important issue, and in fact, the first issue that starts affecting the economy, total energy supply is an even more important issue. The turning point that is important is when energy consumption stops growing rapidly enough–that is, greater than the 2% per year needed to support adequate economic growth.
The growth in oil consumption first fell below the 2% level in 2005, which is the year some that some observers have claimed that “conventional” (that is, free-flowing, low-cost) oil production peaked. If we look at all types of energy consumption combined, growth fell below the critical 2% level in 2012. Both of these issues have made the world economy more vulnerable to recession. We experienced a recession based on prices that were too high for consumers in 2008-2009. It appears that the next bottleneck may be caused by energy prices that are too low for producers.
Recessions that are based on prices that are too low for the producer are the more severe type. For one thing, such recessions cannot be fixed by a simple interest rate fix. For another, the timing is unpredictable because a problem with low prices for the producer can linger for quite a few years before it actually leads to a major collapse. In fact, individual countries affected by low energy prices, such as Venezuela, can collapse before the overall system collapses.
While the Peak Oil model got some things right and some things wrong, the models used by most conventional economists, including those included in the various IPCC reports, are far more deficient. They assume that energy resources that seem to be in the ground can actually be extracted. They see no limitations caused by prices that are too high for consumers or too low for producers. They do not realize that affordable energy prices can actually fall over time, as the economy weakens.
Conventional economists assume that it is possible for politicians to direct the economy along lines that they prefer, even if doing so contradicts the laws of physics. In particular, they assume that the economy can be made to operate with much less energy consumption than is used today. They assume that we collectively can decide to move away from coal consumption, without having another fuel available that can adequately replace coal in quantity and uses.
History shows that the collapse of economies is very common. Collectively, we have closed our eyes to this possibility ever happening to the world economy in the modern era. If the issue with collapsing demand causing ever-lower energy prices is as severe as my analysis indicates, perhaps we should be examining this scenario more closely.
Note:
[1] There was a higher spike in oil prices in 2008 but averaged over the whole year, the 2008 price was lower than the continued high prices of 2011.
Disclosure: None.


