
Why Gold Is Moving Higher From Here
The money keeps flowing, the debt keeps growing, inflation is spiking, and gold is likely going substantially higher from here.

Image Source: Pixabay
Crucial factors like bond rates, inflation, the Fed's balance sheet, monetary expansion, debt, and other elements strongly imply that gold should make another significant move higher soon. Also, it's not just gold that should appreciate notably from here, but the broader gold, silver, and gold/silver mining ("GSM") space should do well.
Let's Look at What the Charts Are Telling Us
Fed's Balance Sheet
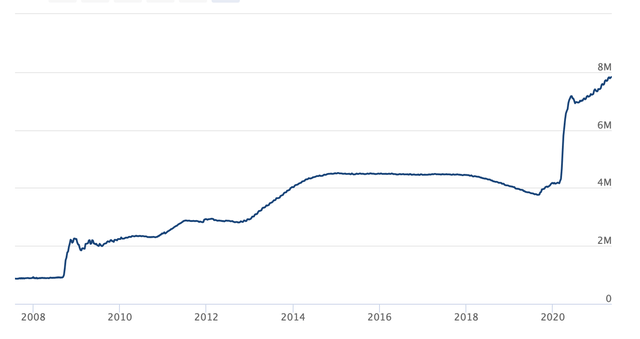
Source: federalreserve.gov
Let's start with the Fed's balance sheet. The Fed has expanded its balance sheet notably ever since quantitative easing ("QE") became the norm. Before the financial crisis of 2008, the Fed's balance sheet was right around $880 billion. However, after multiple rounds of QE, the Fed's balance sheet has ballooned to roughly $8 trillion now. The Fed has purchased trillions of dollars in Treasuries and other debt obligations over the last 13 years to prop up the U.S. economy.
U.S. Monetary Base
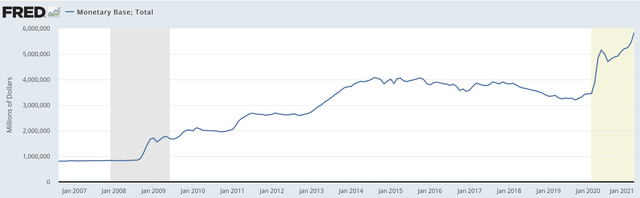
Source: fred.stlouisfed.gov
Here's what the Fed's balance sheet expansion is doing to the U.S.'s monetary base. Like the Fed's balance sheet, we see that the monetary base was between $800-900 billion in 2007 and early 2008. Then, as the Fed began buying up Treasuries and other debt obligations, the monetary base took off. Recently, we saw another spike as the COVID-19 crisis threatened to crash the U.S. economy. Now the monetary base is approaching $6 trillion, but given that it appears to lag the Fed's balance sheet expansion, it is likely to play "catch up" and should continue to climb higher from here.
U.S. Federal (Public) Debt
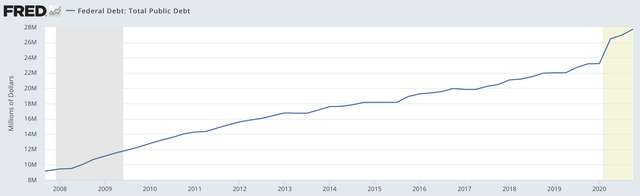
The debt image is grim, and we can see that the U.S. debt is moving up simultaneously with the Fed's balance sheet and the monetary base. The public debt is now at approximately $23 trillion. Perhaps more alarmingly, the Federal debt to GDP ratio is now at roughly 128% (this is relative to just 58% in 2000 and 35% in 1980). Moreover, if we take total U.S. debt, it towers at a whopping 143% of GDP now.
Also, the actual Federal budget deficit is around $3.6 trillion, relative to just $3.5 trillion in tax revenues. Let's think about that for a second. The U.S. spends about $7.1 trillion but brings in revenues of just $3.5 trillion. Yes, I know, there is increased spending due to the coronavirus now, but trillion-plus dollar deficits have become the norm in recent years, not an exception.
U.S. 10-Year Treasury
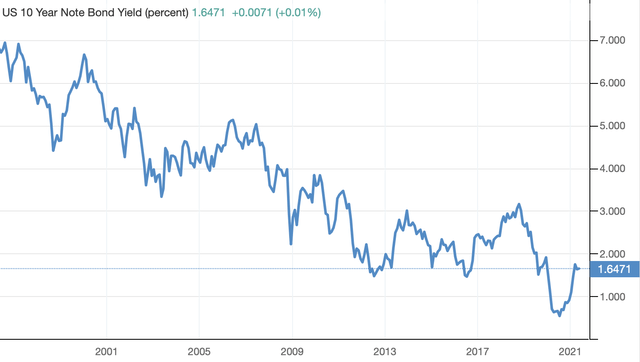
Source: tradingeconomics.com
Here's what has happened to the 10-year Treasury and other rates throughout all this. Like most forms of debt, the U.S.'s public debt needs to get serviced. As much of the $23 trillion debt load is comprised of U.S. 5, 10, and 30-year Treasuries, its servicing payments most closely resemble the 10-year yield. At current yield and debt load, the U.S. (U.S. taxpayers) would dish out approximately $380 billion in annual servicing payments alone. Thus, as the U.S. debt load increases perpetually, key rates need to be suppressed continuously to prevent the servicing from spiraling out of control.
Fed Funds Rate
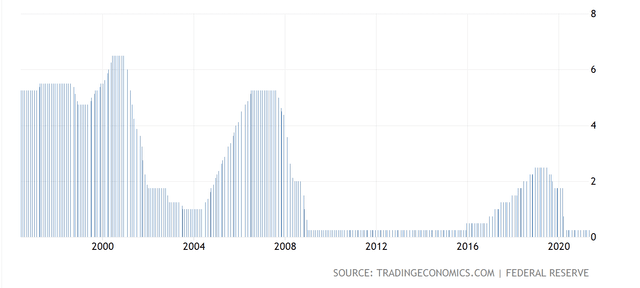
Here's what the Fed Funds rate is doing. While the Fed could afford to keep the Funds rate elevated before (4-5% or higher), it cannot do so anymore. The Fed attempted to "normalize" rates in 2016-2018, but it became evident that the economy could not expand or function effectively with the Funds rate slightly higher than 2%. There is too much debt in the system, and the economy has grown accustomed to abnormally low rates. Therefore, any notable future increases in the Funds rate or key Treasuries are unlikely, barring a high inflation environment.
What About Inflation?
CPI Inflation
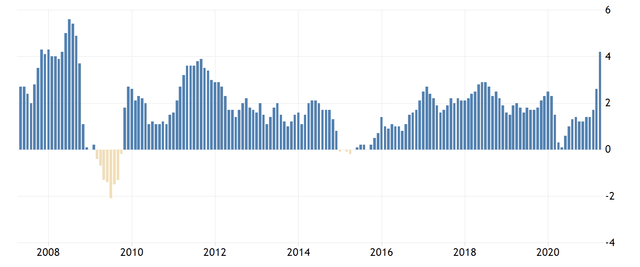
The CPI gauge is one of the best indicators for consumer inflation. Now, the CPI just showed a 4.2% YoY increase, something not seen since 2008. It is also important to point out that in 2008 the Funds rate was at around 4-5%, now it is at zero. The 10-year was at about 4%, and now it is at 1.6%. So, what we have now is a heightened inflationary environment during an ultra-low interest rate regime. Moreover, due to the enormous money printing, and the staggering debt, this does not appear to be a transitory phenomenon. Furthermore, in 2008, inflation was peaking but it looks like inflation is just starting to heat up this time around.
PPI Inflation
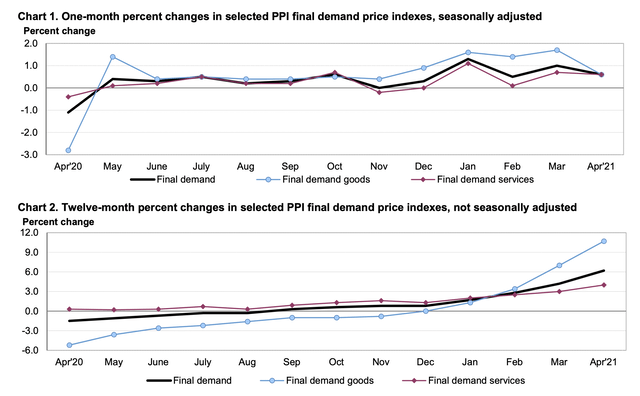
Next, let's look at PPI (producer) inflation numbers. We see that on a YoY basis producer prices relative to final demand goods surged by more than 10%. These are remarkable numbers, and for anyone that thinks this is just due to the coronavirus-induced phenomenon, the MoM chart says differently. The MoM chart illustrates robust price growth throughout recent months, especially pertaining to final demand goods. This producer price inflation is hot, and it should get passed down to the consumer in the future. Therefore, we should continue to see elevated inflation from here.
As Far As the Fed is Concerned
PCE Inflation
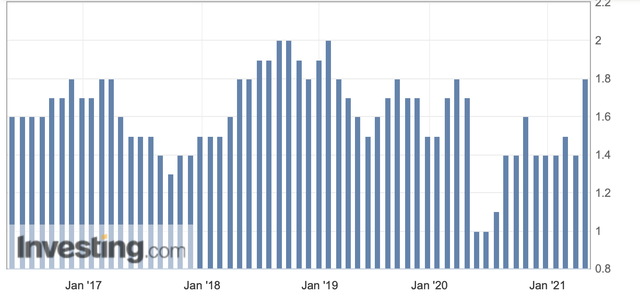
Source: investing.com
The Fed conveniently uses the core-PCE as its preferred inflation gauge. April's inflation number is not in yet, but it should come in at about 2.4%. The PCE projection is not close to the 4.2% CPI, or the elevated PPI figures. Also, the Fed could view this as a transitory increase. Prices dropped off sharply due to the coronavirus pandemic. The Fed has implied that it is going to "tolerate" inflation above 2%. Some say tolerate, or achieve inflation moderately above 2% for some time. I say this could be the new normal, where inflation goes notably higher for longer this time.
The Bottom Line: Why This is Good for Gold
Well, let's start with the monetary base. Due to the Fed's perpetual easing, the monetary base has ballooned by nearly sevenfold since around 2008. Now, some believe that this "excess liquidity" will get extracted from the monetary system somehow. However, this may not be the case. The Fed attempted to tighten in 2016-2018, and the attempt failed, as the Fed could not normalize the Funds rate modestly above 2% without the economy illustrating imminent signs of contraction. Therefore, this may not be excess liquidity. Instead, this could be money that got injected into the economy, got absorbed, and more should be required going forward.
While the monetary base is up by around 600% over the last 13 years, gold is up by less than 200%. If gold were to appreciate like the monetary base, gold would be at approximately $5,600 an ounce right now. Next, the debt is massive, and it is likely only going to go higher from here. The higher the debt goes, the more costly it is to service, unless key Treasury rates continue to slide. We've seen this trend for decades now as the debt continuously increases. To keep the debt issue from becoming unmanageable, the U.S. needs low treasury rates, but for treasury rates to remain low, the Fed needs to keep the Funds rate low, preferably around zero.
However, inflation is heating up, and the only viable tool to combat higher prices is to raise interest rates. The Fed has signaled that it is ready to tolerate inflation moderately above 2%, which is yet to materialize per the PCE gauge. A key question now is, will the Fed go back on its word, and will the agency risk throwing the U.S. back into recession during such a fragile recovery process? In my view, the Fed cannot afford to do so, especially now, but even when the Fed does begin to raise rates gradually, it may not be enough to cool off the rise in inflation.
Treasuries compete with gold for market share in the safe-haven market. Yet, if Treasuries deliver a negative inflation-adjusted return, they are not very attractive investment vehicles. With inflation running above 2% now, key Treasuries provide negative returns (inflation-adjusted). In this environment, gold is a viable substitute to Treasuries and is the time-tested hedge against inflation. As it becomes evident that the excess liquidity is not getting mopped up, gold could surge to around $5,000 or higher to keep pace with its price to U.S. monetary base expansion correlation.
Several GSM Stocks to Consider
Kirkland Lake Gold (KL)
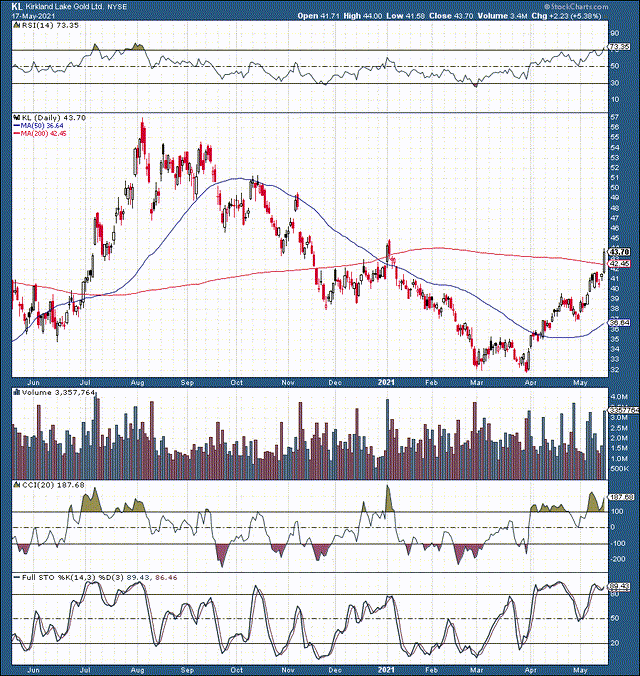
Source: stockcharts.com
Kirkland is cheap, as the stock trades at only around 11.9 times next year's consensus EPS estimates. Moreover, future revenue and earnings estimates could be based on relatively low gold price assumptions, as some analysts may be behind the curve relative to gold price projections. Therefore, KL and other GSM companies should illustrate higher growth and should make more money than the market is pricing in right now.
Kinross Gold (KGC)
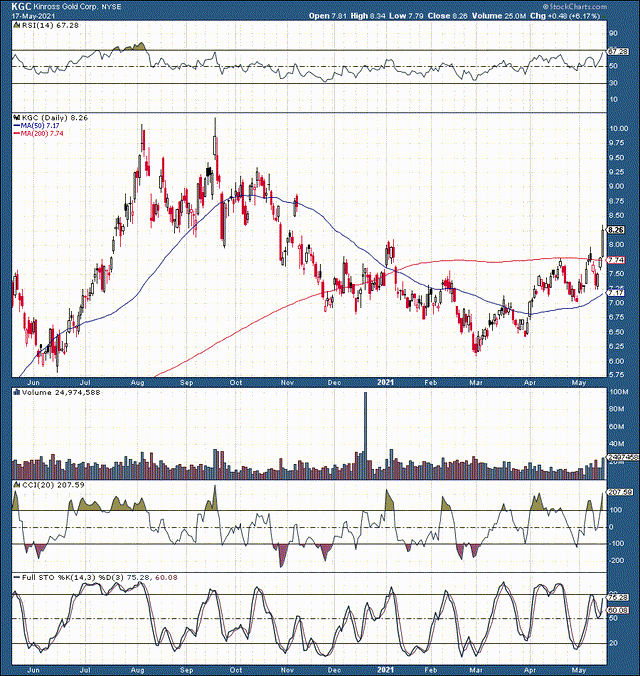
Kinross is another cheap name with a lot of upside potential. This company trades at only about 9.3 times 2022's projections, and revenues should increase by about 13% this year.
Alamos Gold (AGI)
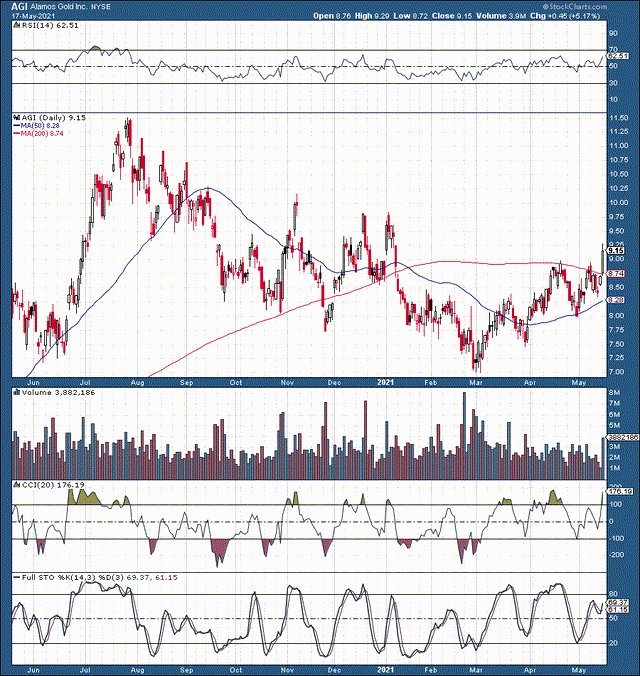
Alamos is another great name in the gold mining space. This stock trades at around 15 times 2022's EPS estimates and offers compelling revenue and earnings growth. Furthermore, AGI should also bring in higher revenues and income than current estimate figures suggest.
Pan American Silver (PAAS)
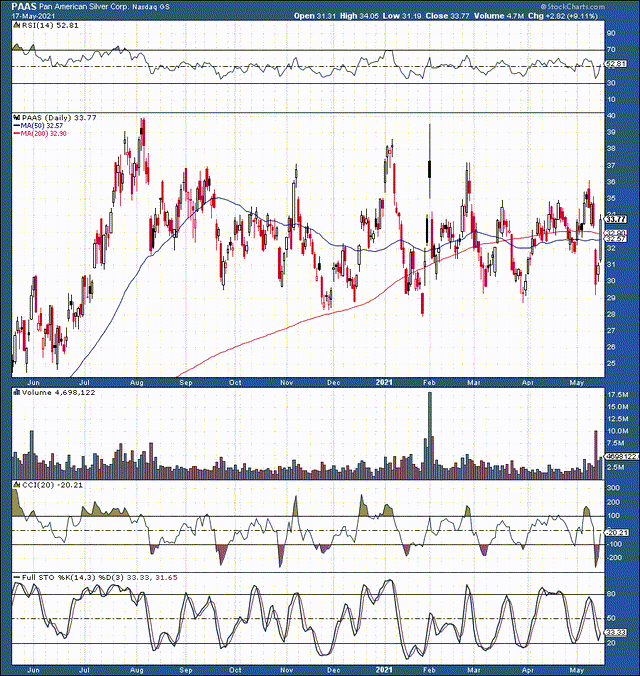
Pan American is primarily a silver miner, but the company also derives gold, copper, zinc, and other metals. The company trades at around 14 times 2022's consensus estimate EPS figures. Additionally, Pan American is expected to grow revenues by roughly 20% this year. Much like gold price growth projections, silver price growth is also likely notably under-appreciated right now. With the silver bull market continuing alongside gold, silver miners should produce substantially higher revenue and EPS growth in coming years.
Fortuna Silver (FSM)
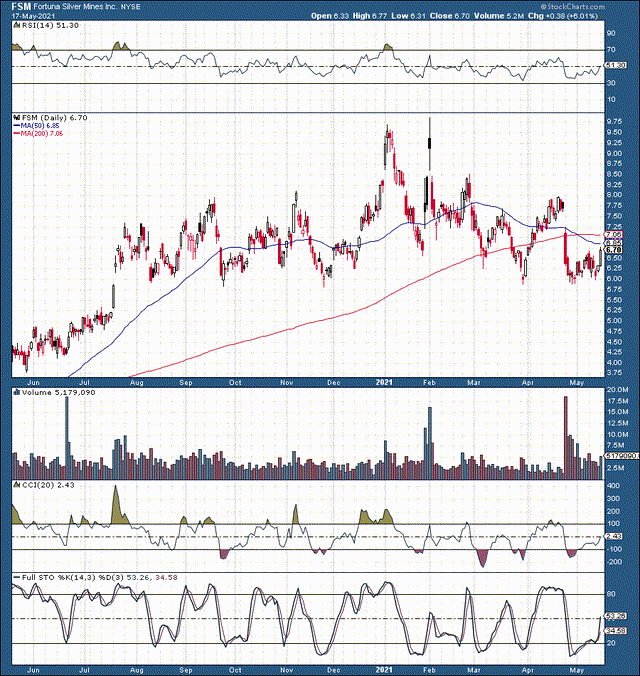
Fortuna Silver is another top name in the GSM industry. This stock trades at only around 8.6 times 2022's consensus analysts' EPS estimates. Also, future revenue and earnings projections are likely based on relatively low precious metals price projections.
Many gold/silver miners' estimates illustrate stagnating or declining earnings growth after 2022. This is likely why this sector is still so cheap right now. It appears that many analysts believe that the GSM bull market will come to an abrupt end next year. However, I believe that we are likely still in the relatively early stages of a significant bull cycle in GSMs and commodities in general. Therefore, prices could appreciate for several years beyond 2022, in which case we could be looking at widespread upward revisions and sharply higher prices in GSM names across the board.
Disclosure: I am/we are long KL, AGI, KGC, FSM, PAAS.
Disclaimer: This article expresses solely my opinions, is produced for informational purposes only, and is not a recommendation to ...
more

