
When Will The Turnaround In Gold Likely Come? Implications For Silver?
In yesterday's analysis, we emphasized that even though a big decline in gold is already underway, it's likely that it won't be a straight move down and there will be periodic corrections. Moreover, we provided price targets from which the bounce could start. Based on the circumstances, it might even be a tradable move. In today's analysis, we're going to show you that there are signals suggesting that the turnaround might start relatively soon - during this month.
But first, let's take a look at the most recent price changes.
Yesterday's Moves in PMs
(Click on image to enlarge)
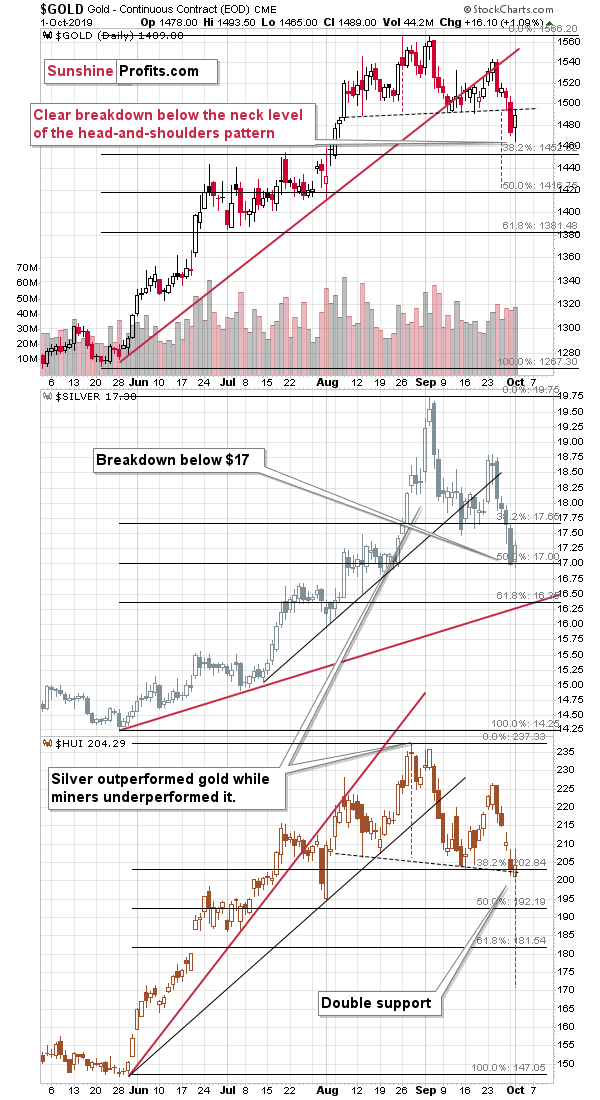
The most important thing that happened on the gold market is the breakdown below the $1,500 level and below the neck level of the head-and-shoulders pattern. Earlier, both levels prevented gold from declining further and now this is no longer the case. Gold can slide.
The head and shoulders pattern suggests a move to at least $1,425 as that's the size of the head of the pattern. There are other factors that need to be considered as well. The Fibonacci retracements provide useful targets as well. The first one is relatively close, at about $1,450, the second is at about $1,416, which is relatively close to the above-mentioned $1425 level, and the third is at about $1,381.
The previous highs and lows also play a part. There are quite a few such extremes that formed in June and July, but they are more or less in tune with the Fibonacci retracements, so they don't add much to the above.
Taking both: the head-and-shoulders and the Fibonacci retracements into account, it seems that gold is more likely to bounce from about $1,420 than from other price levels. The $1,381 level might be the something that generates a rebound as well but it's not as likely as the $1,420 level. At least not based on the above chart.
Based on the long-term gold and silver charts that we featured in yesterday's Gold & Silver Trading Alert, we have indications that gold might bounce from about $1,420, and from the $1,360 - 1,380 area. This coincides very well with the above-mentioned price levels.
The most important take-away, though, is that gold is not likely bottoming right now. Sure, it moved higher yesterday, but it didn't rally back above the neck level of the head-and-shoulders pattern, which means that yesterday's rally was just a verification of the breakdown - nothing more. Consequently, it didn't change the bearish implications of the latter, and the short-term outlook remains bearish.
Please note that while gold moved visibly higher on a day-to-day basis, gold miners didn't. The HUI Index ended the session by just 0.5% higher. This underperformance shows that the breakdown below the head and shoulders pattern was not accidental and that it's likely to slide further.
In the opening paragraph of today's analysis, we wrote that there are signs that we'll see a corrective upswing in the following weeks. Both signs come from applying the triangle-vertex-based reversal technique. Let's take a look at them.
Triangles, Trend, and Reversals
(Click on image to enlarge)
(Click on image to enlarge)
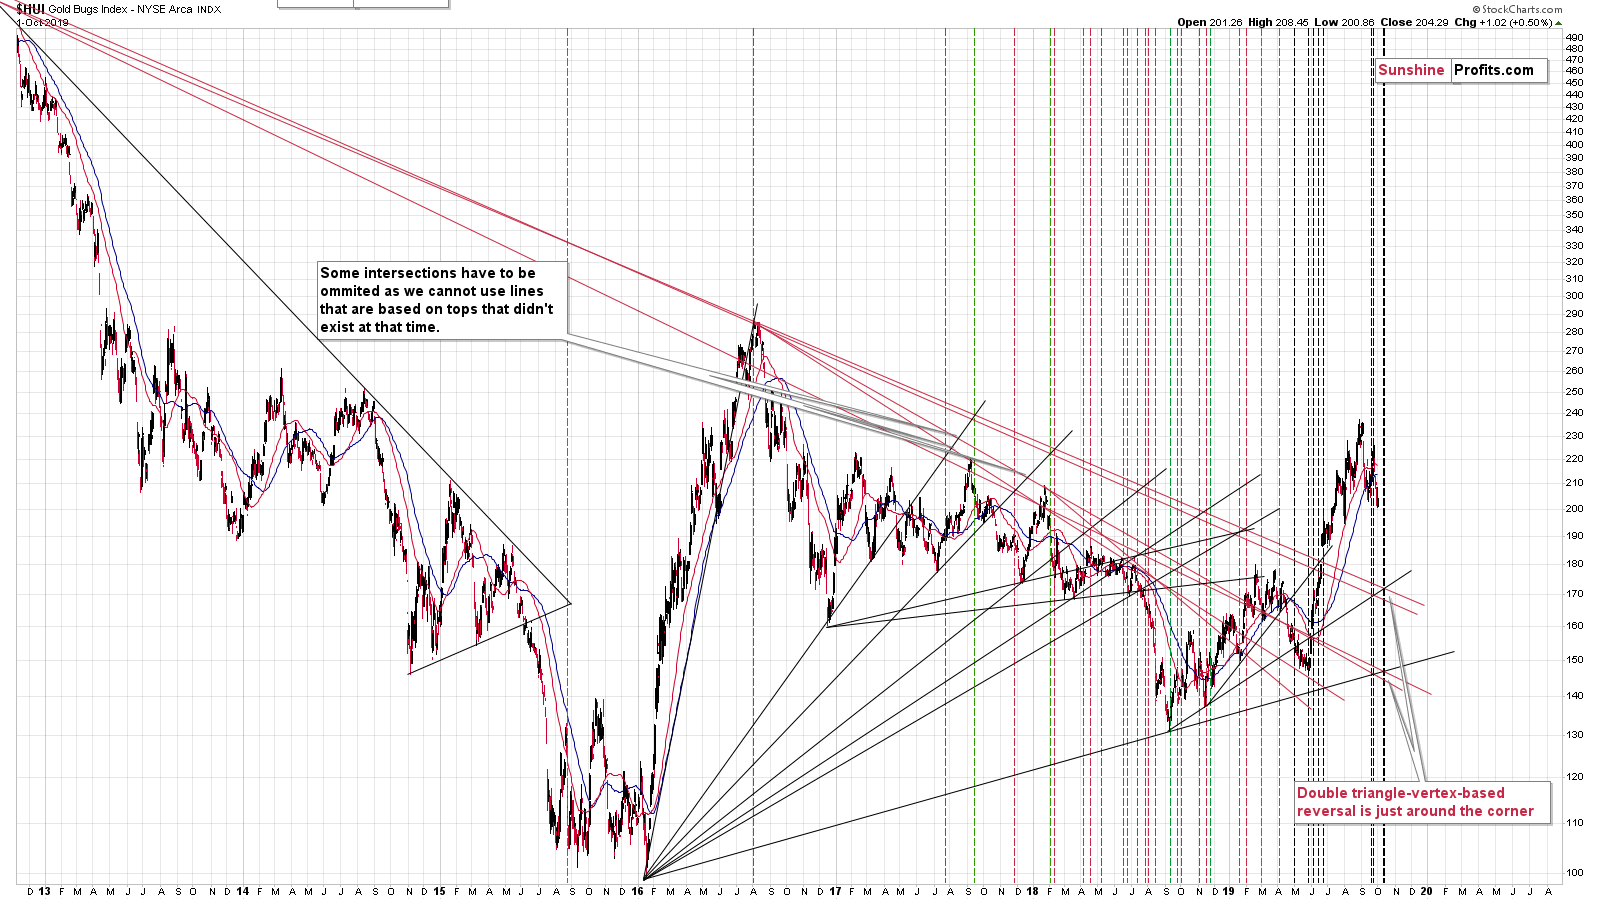
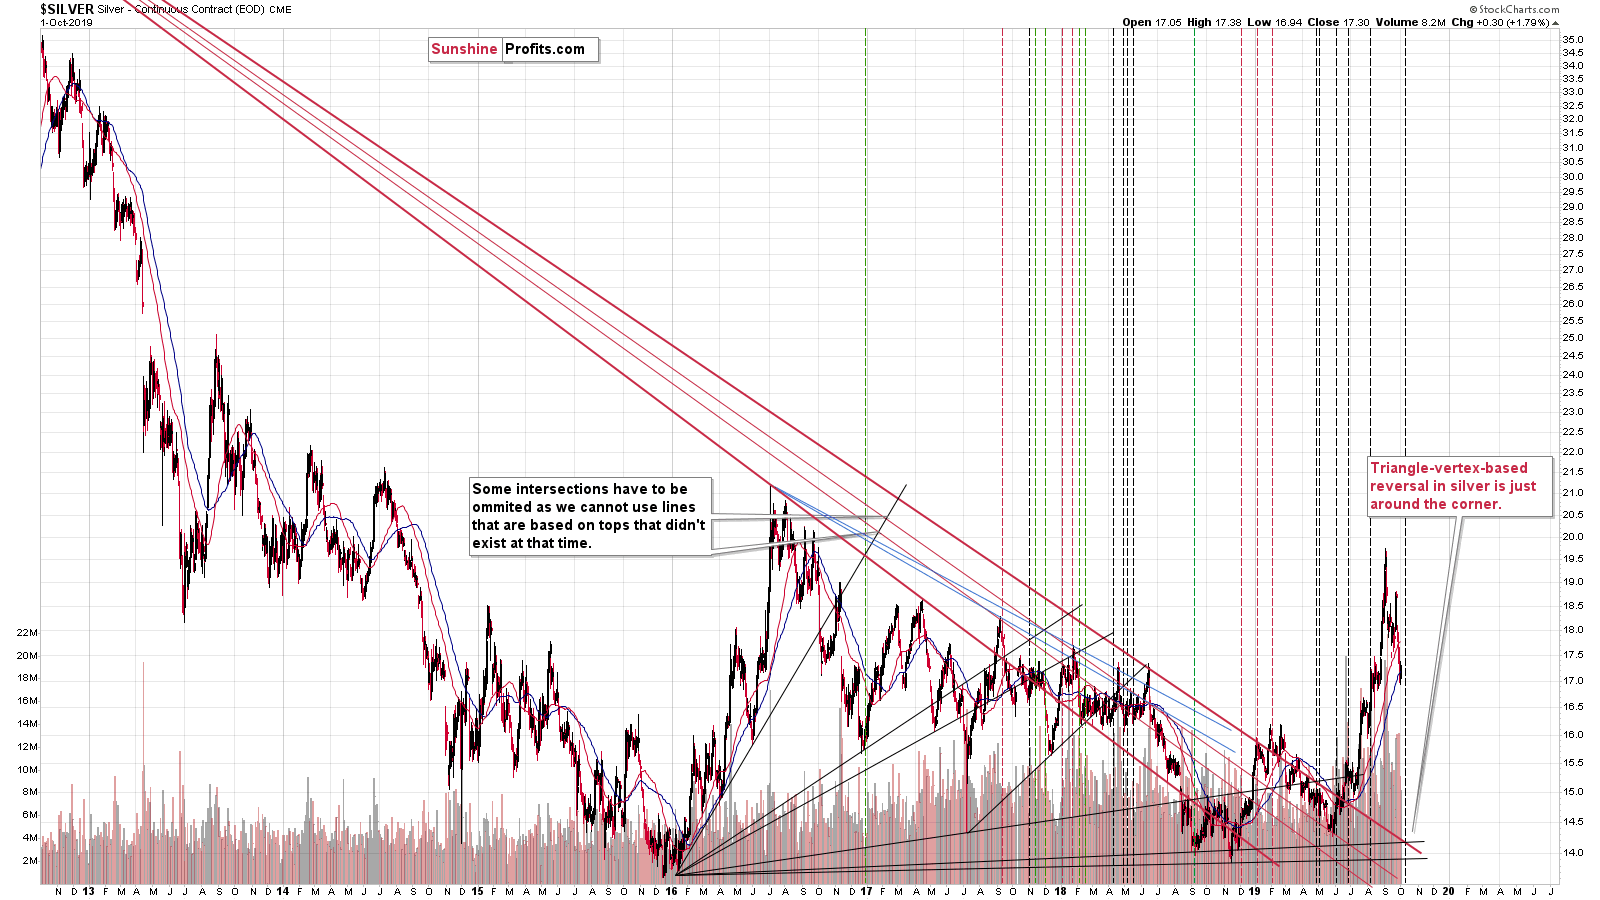
Both silver and the HUI Index are very close to the point in time where two (silver) or four (HUI) previous resistance and support lines cross. These moments tend to mark important reversals for a given market. Of course, this is not always the case, but it is the case often enough to make this trading technique useful, especially if it's confirmed by more than one vertex. There are three vertexes (two in case of the HUI Index and one in silver) that point to a nearby reversal. And by nearby, we mean the middle of the month.
The entire precious metals sector is likely to correct more or less at the same time, so this implies also a correction in gold.
Does it mean that the gold, silver, and miners' decline is about to be over? Absolutely not. Gold probably has hundreds of dollars to go before the bottom is in, similarly to how it declined in the second part of the 90s or in late 80s. This does, however, mean that we might see a short-term turnaround after gold, silver, and mining stocks decline some more.
This month's seasonality chart for silver confirms the bearish indications.
Silver and Q4 Seasonality
(Click on image to enlarge)
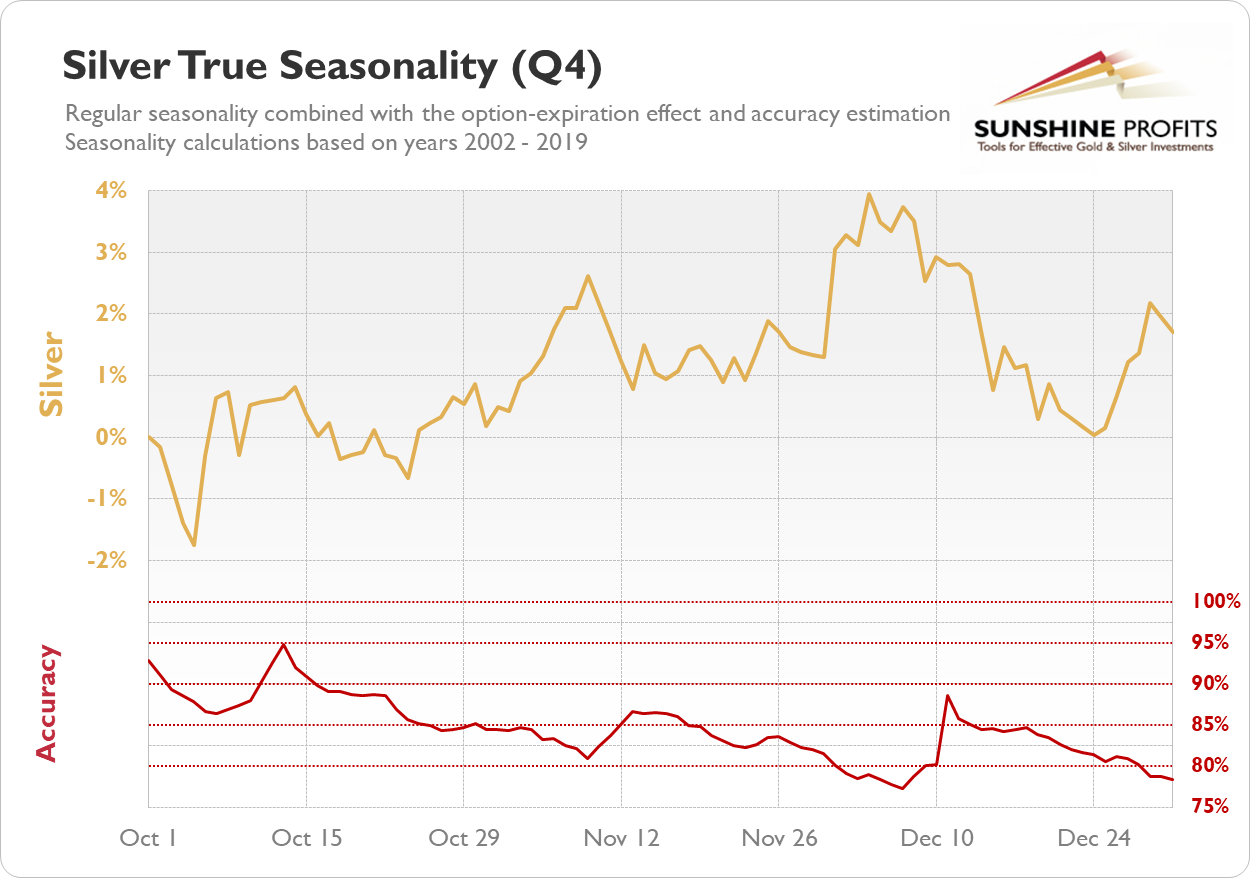
You can read more detailed seasonal silver analysis over here, but the long story short is that the declines are likely to take place in the 3 weeks of the month, in particular at the very beginning of the month. Any strength is likely to be seen closer to the end of the month, and perhaps in early November.
All the above paints a quite coherent short-term picture: the precious metals sector declines shortly, but starts a corrective upswing from lower price levels close to the middle of the month.
Before summarizing, we would like to briefly reply to a boomerang question that we just received. "Boomerang" because it comes back every couple of weeks or months. The question is why is comparing the current price moves to a relatively distant past (like the mid-90s) useful if the fundamental situation is different (e.g. interest rates, sovereign debt levels).
Surely, the fundamental situation differs. Not only interest rates, debt levels, but geopolitics in general. The presidents and prime ministers come and go, the monetary authorities change, and the world is developing in a non-linear way in general. However, fear and greed have been and will always be present and as long as the capital markets are available, their participants will make decisions based not only on logical fundamental factors but also based on the emotional determinants. No geopolitical situation will make any free market (let's not debate the gold manipulation and silver manipulation theories here - they are definitely free to a major extent and at the same time no market is completely free as long as the interest rates are artificially set) price move up or down in a straight line continuously. People will always get ahead of themselves with their optimism and greed and then they will get ahead of themselves with their pessimism and desperation and hate toward a particular sector. And that's what makes bull markets and bear markets unfold in specific ways - where there are periodic corrections and where there are medium-term downtrends that are opposite of the very long-term uptrends.
The Western world's debt is ballooning, interest rates are ridiculously low and there are massive trade tensions. Monetary officials are determined to stimulate the economy even though it doesn't really want to respond to the stimuli in the way that it used to. And it's all very positive for gold... In the long run.
And in the long run, we don't expect gold to decline as low as it declined after the mid-90s top. As a reminder, gold bottomed several years later very close to $250. No, we don't expect anything like that. The fundamentals definitely justify much higher gold prices. Will gold's upcoming bottom be twice as high as the one that we saw about 20 years ago? Or three times as high? Or more? Please note that by saying that a medium-term slide is very likely, we are not telling anyone that gold should get back to its value from 20 years ago.
However, based on the way gold performed after parabolic upswings (when greed was at its extreme), it tends to perform relatively similarly. For instance, both the 1980 and 2011 price spikes were followed by very sharp declines. There are numerous other ways in which we can detect what kind of situation is similar to what we see right now and when more of them point to the same outcome, the latter becomes likely. There are numerous reasons for gold to decline right now, even though it's likely to rally in the long run. The massive breakout in the USD Index is one of the most important factors, but there are also many others. The fact that gold was the only part of the precious metals sector that really rallied this year serves as a perfect confirmation. Gold stocks should be rallying strongly in the early part of the bull market, just like they did in the early 2000s. The opposite has been happening in the previous months. Why? Because gold, silver, and mining stocks haven't fallen enough and need to decline some more before the investors enter the fear, desperation and hate stage. That's when true bottoms are formed, not when people continue to expect higher gold prices (which was the case based on the surveys conducted in late 2015).
Summary
Summing up, the big decline in the precious metals sector appears to be finally underway. While there will be periodic corrections, it seems that we will see them only after gold, silver and mining stocks decline some more - possibly close to the middle of October. In today's analysis, we updated our short-term downside targets based on the latest information as the recent decline is not as sharp as the 2011 one, so the technique that predicted the 2011 correction might not apply here.
Disclaimer: All essays, research, and information found on the Website represent the analyses and opinions of Mr. Radomski and Sunshine Profits' associates only. As such, it may prove wrong ...
more

