
When Will Gold Break Out?
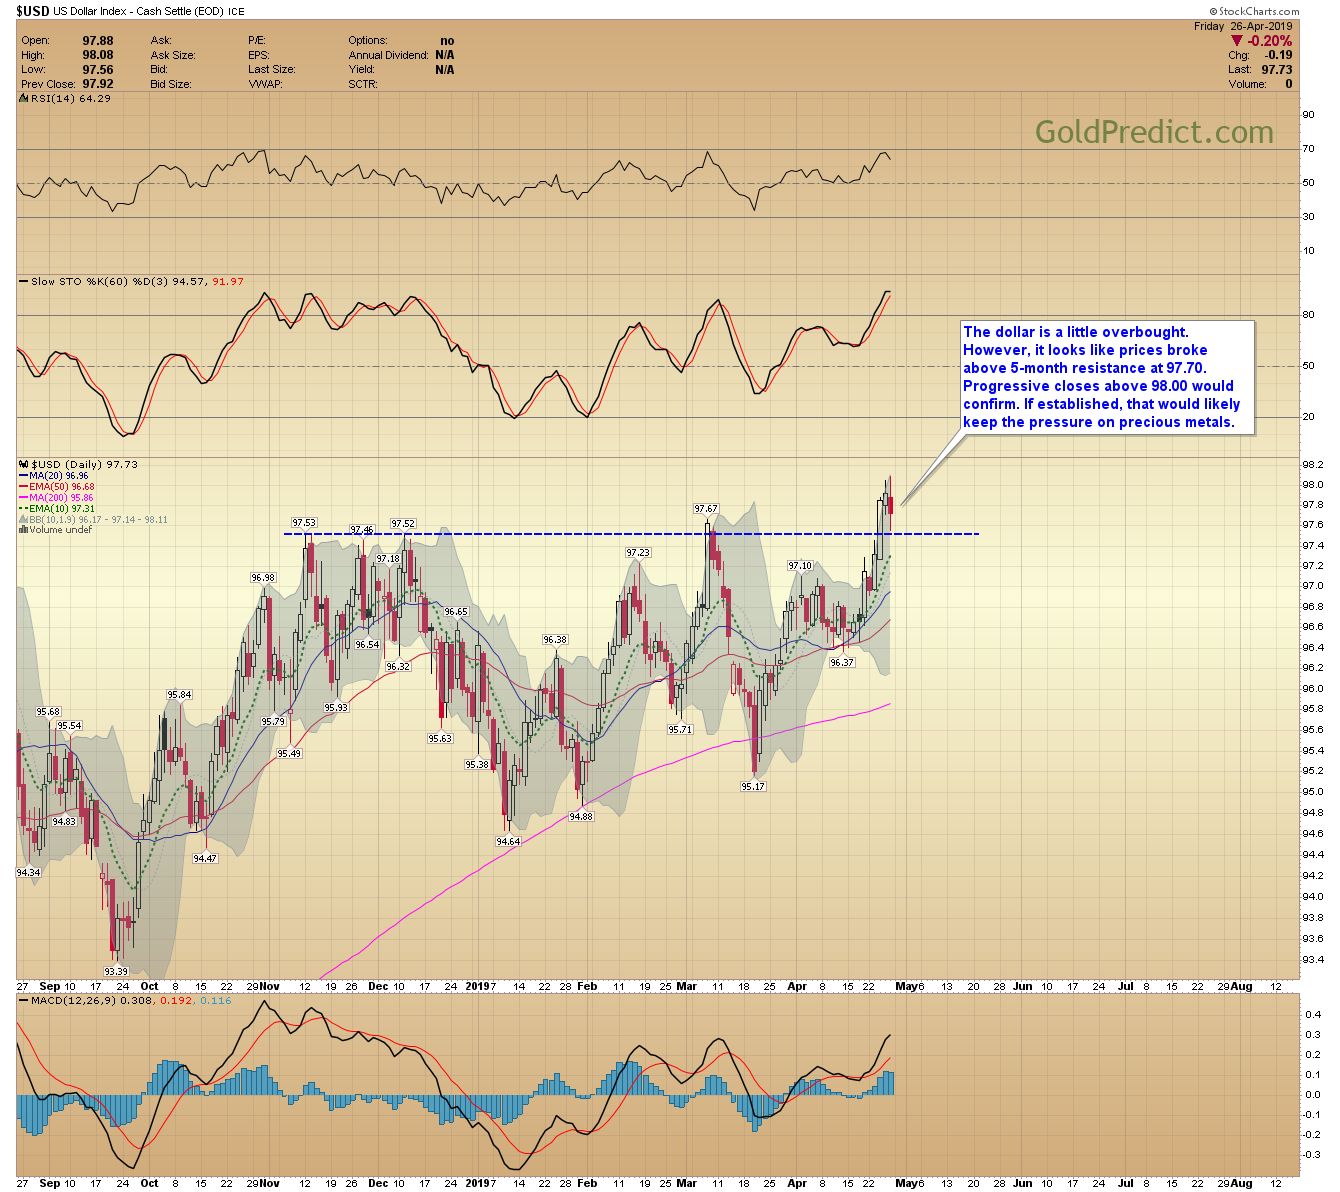
US DOLLAR
The dollar is a little overbought. However, it looks like prices broke above 5-month resistance at 97.70. Progressive closes above 98.00 would confirm. If established, that would likely keep the pressure on precious metals.
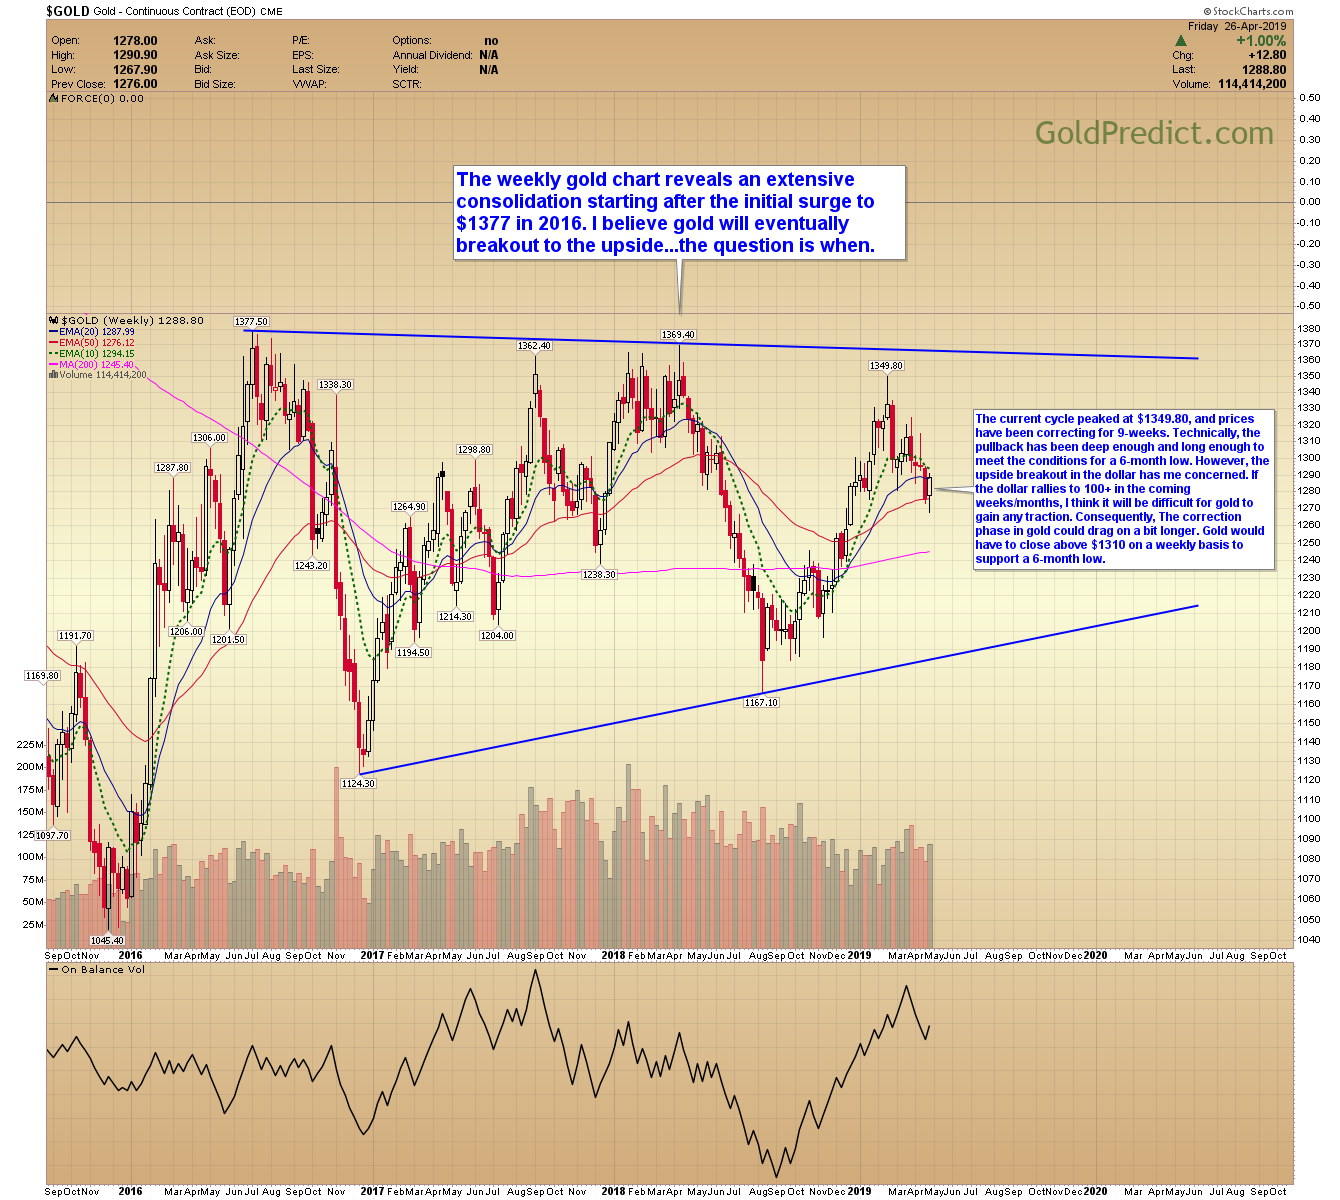
GOLD WEEKLY
The weekly gold chart reveals an extensive consolidation starting after the initial surge to $1377 in 2016. I believe gold will eventually breakout to the upside…the question is when.
The current cycle peaked at $1349.80, and prices have been correcting for nine weeks. Technically, the pullback has been deep enough and long enough to meet the conditions for a six-month low. However, the upside breakout in the dollar has me concerned. If the dollar rallies to 100+ in the coming weeks/months, I think it will be difficult for gold to gain any traction. Consequently, the correction phase in gold could drag on a bit longer. Gold would have to close above $1310 on a weekly basis to support a 6-month low.
GOLD DAILY
The daily chart of gold formed a swing low at $1267.90. If this is just a bounce, then prices should rollover between here and the short-term trendline near $1300. A decisive rally above $1310 would support a six-month low.

SILVER WEEKLY
The longer-term silver chart is forming a broad base around $14.00. Since 2016, each rally has been capped just above the flattening 200-week MA. A decisive breakout above $17.00 would signal the next significant upswing in silver prices.

SILVER DAILY
The daily silver chart reveals a descending wedge formation that could produce an upside breakout. If established, I would expect a retest of resistance around $16.20. Breaking above $16.20 would recommend a test of the larger pattern trendline near $17.00.

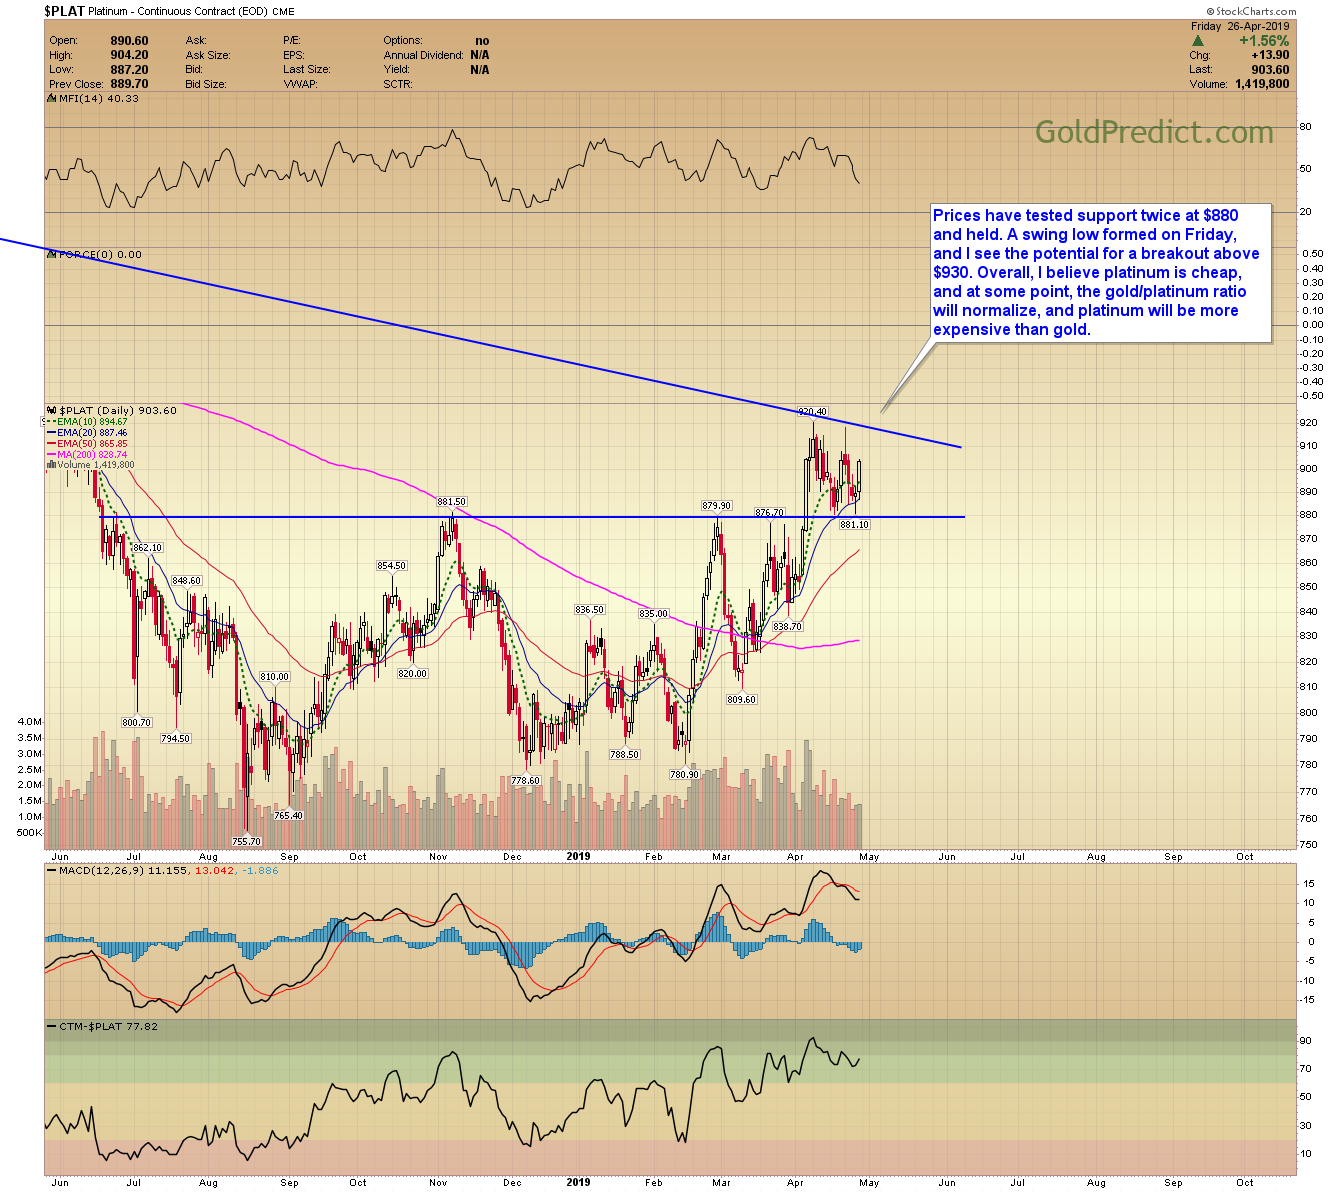
PLATINUM
Prices have tested support twice at $880 and held. A swing low formed on Friday, and I see the potential for a breakout above $930. Overall, I believe platinum is cheap, and at some point, the gold/platinum ratio will normalize, and platinum will be more expensive than gold.
GDX
Gold miners tested the confluence of support at the trendline, January gap, and the 200-day MA. Prices formed a swing low at $20.67. It is hard to say if this is just an oversold bounce or the beginning of a more meaningful rally. It would take a decisive move above $22.00 to support more than just a quick rebound.

GDXJ
Prices closed back above the 200-day MA on Friday. Significant short-term resistance has formed between $30.75 and $31.25. Junior minors would have to breakout above the short-term trendline near $32.00 to support a more substantial advance.

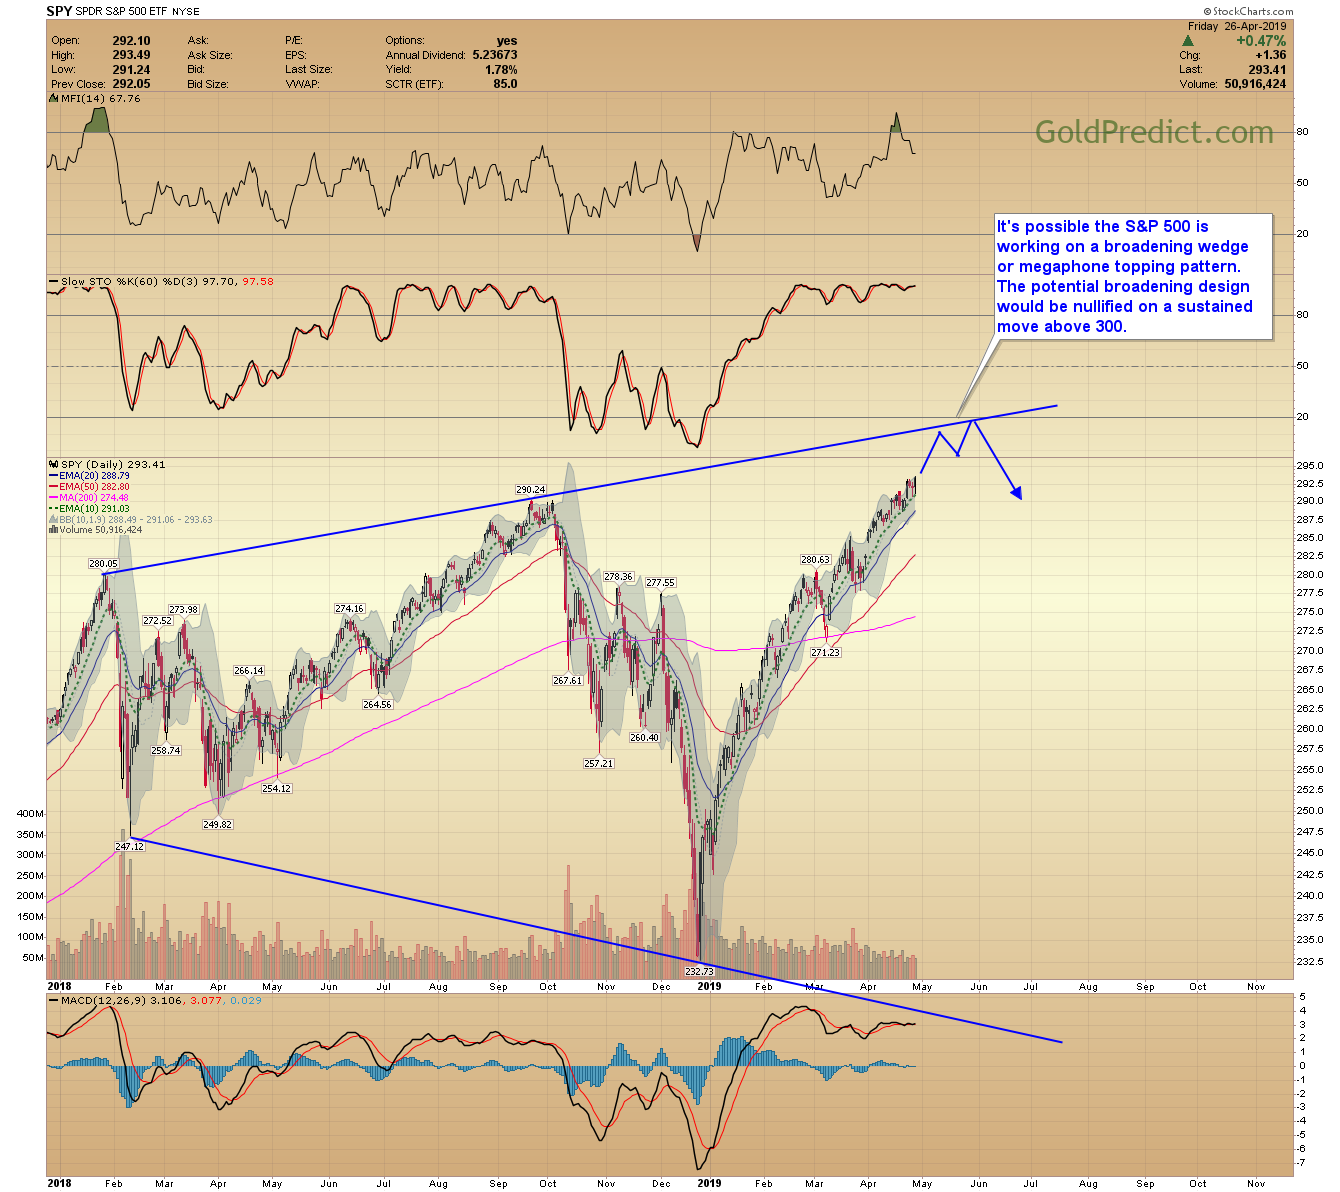
SPY
It’s possible the S&P 500 is working on a broadening wedge or megaphone topping pattern. The potential broadening design would be nullified on a sustained move above 300.
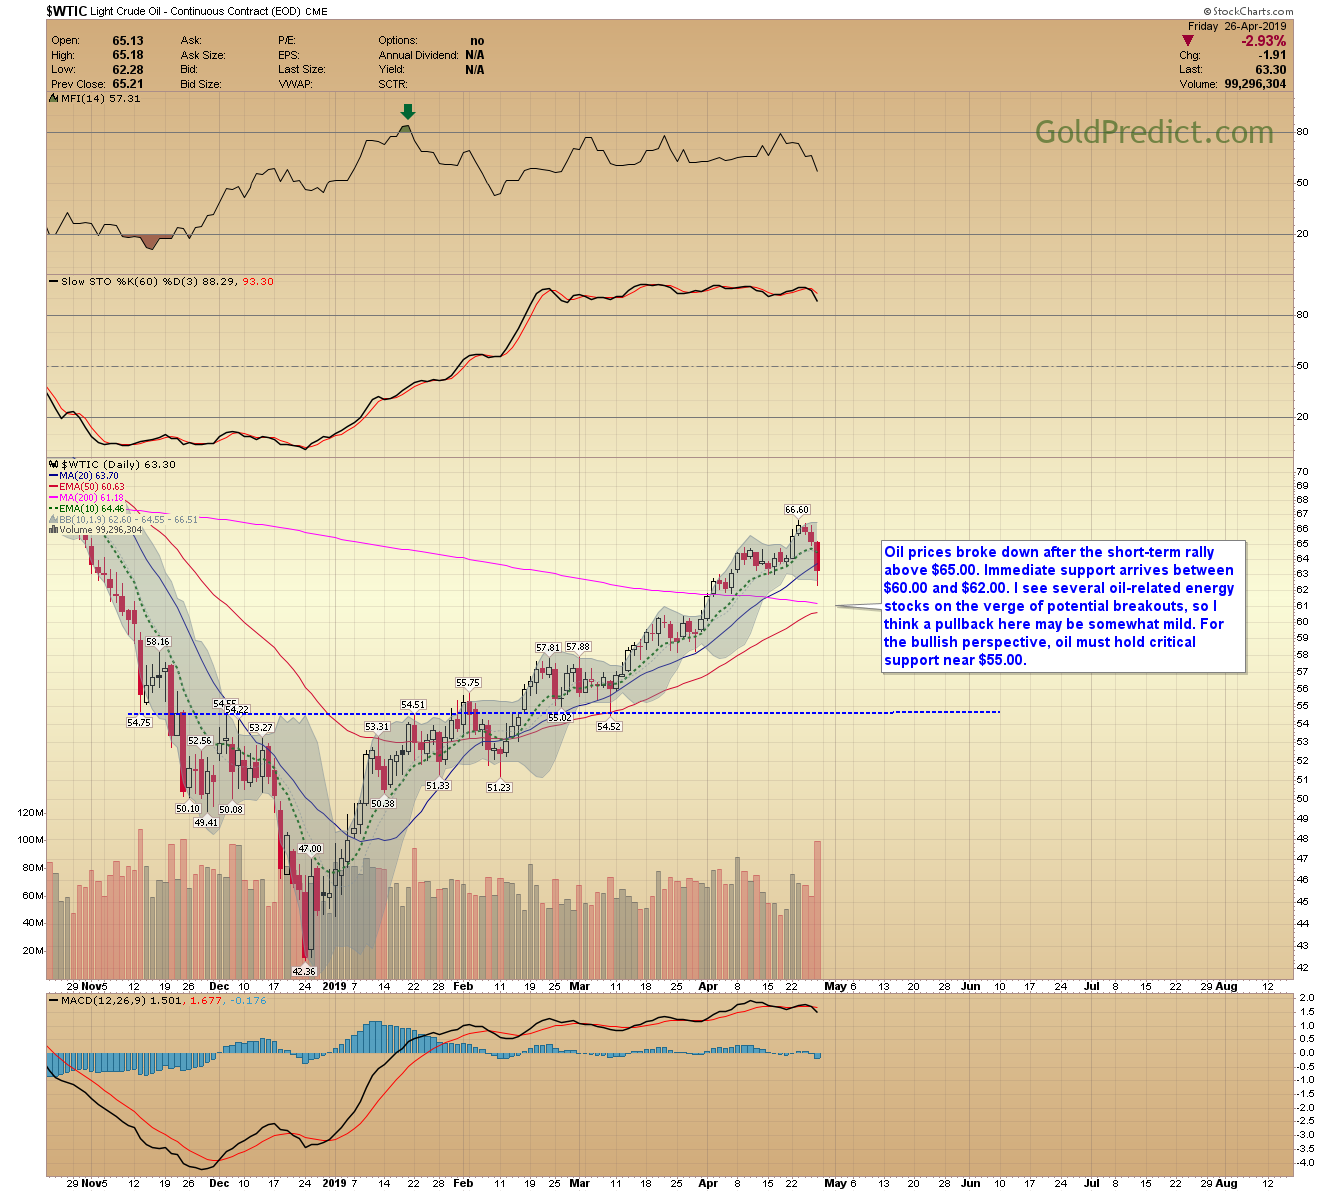
WTIC
Oil prices broke down after the short-term rally above $65.00. Immediate support arrives between $60.00 and $62.00. I see several oil-related energy stocks on the verge of potential breakouts, so I think a pullback here may be somewhat mild. For the bullish perspective, oil must hold critical support near $55.00.
DNR
Prices are back down testing support near $2.20. To maintain the potential for an immediate rally, I’d like to see DNR stay above last weeks $2.18 low. Progressive closes below $2.18 would support a short-term breakdown.

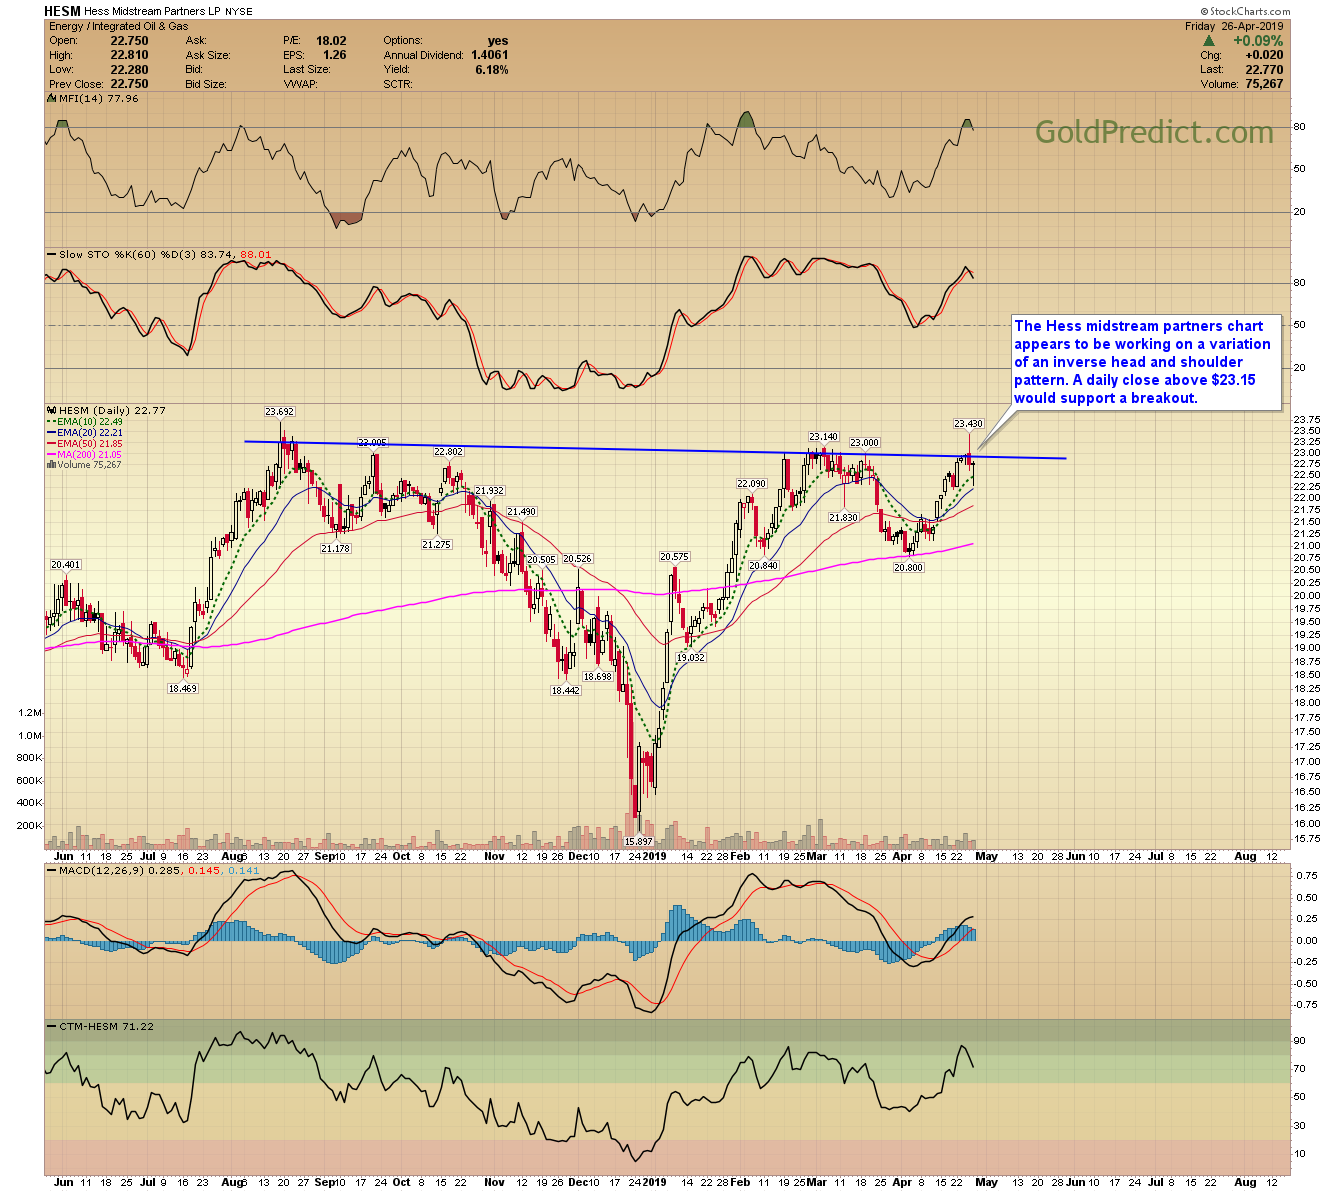
HESM
The Hess midstream partners chart appears to be working on a variation of an inverse head and shoulder pattern. A daily close above $23.15 would support a breakout.
CNQ
Another energy chart I’ve been monitoring is CNQ (Canadian Natural Resources). Prices broke out above $28.75 earlier this month. The current pullback appears to be backtesting the breakout zone and 200-day MA. I will consider a position next week. If established, I would exit on a daily close below $28.50.

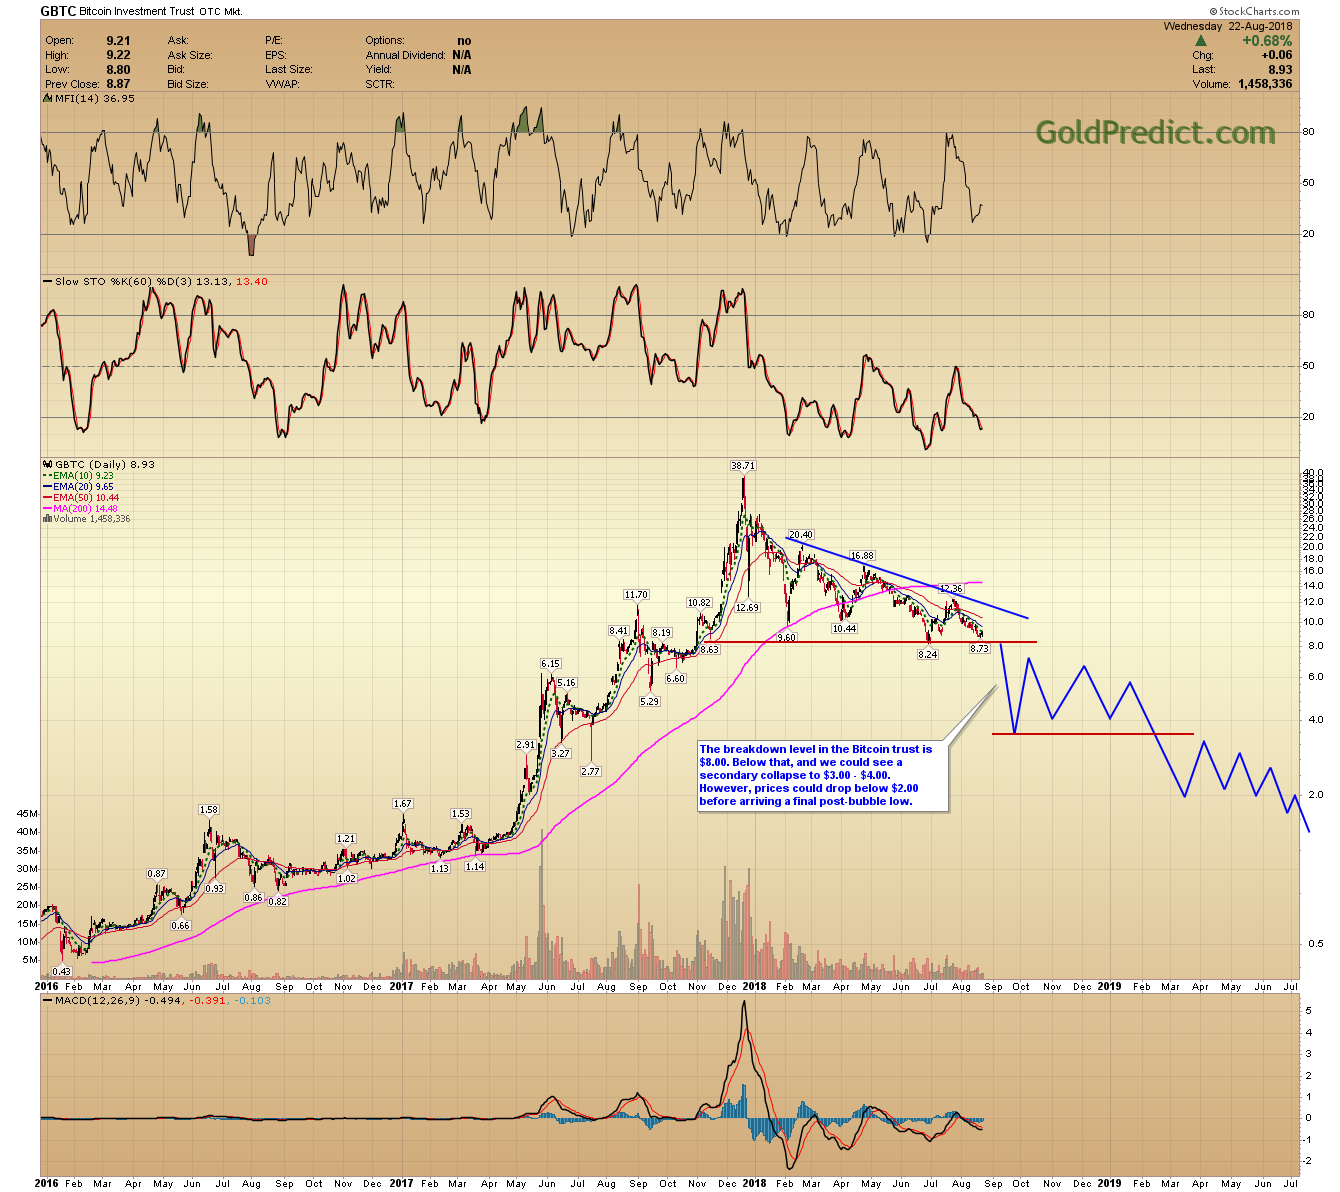
GBTC
My outlook concerning Bitcoin and GBTC remains the same. I believe prices reached a momentous parabolic blowoff top in late 2017. It will likely take some time, perhaps years, for sentiment to normalize. I still see significant bullish calls for much higher prices. That leads me to believe sentiment is a long way from the type of investor despair often associated with major bottoms.
The recent rebound to $7.48 in GBTC is likely just a backtest of the prior breakdown described in the August update. Prices should rollover around here and continue to grind sideways/lower in a consolidation that eventually breaks to new lows. If correct, that implies bitcoin will break down below $3000, and I expect to see $1000 and $2000 before prices begin to base.

I included the August GBTC chart below. It appears prices are adhering to my expectations.
GOLD

HOLD – NEUTRAL
SILVER
HOLD – NEUTRAL
SENIOR MINERS
HOLD – NEUTRAL
JUNIOR MINERS
HOLD – NEUTRAL
Disclosure: None.


