
What Will The U.S. Dollar Ring In For 2021?
The fate of the U.S. Dollar will weigh heavily on the future of the precious metals in 2021. At first glance, the USDX’s prospects look rather bleak in the first months of the year, but as the pages of the book turn, the dollar’s likely later ascension could prove rather bearish for gold and the PMs.
Breaking hearts as the USD Index falls in and out of love, the greenback continues to leave bulls at the altar, which is likely to have important implications for the gold market in the following weeks. Dressed to impress, investors lined the cathedral aisles as the USDX looked ready to commit to the 90-level.
But as cold feet turned into a dash for the exit, 2020 ended without a celebration.
However, as we enter 2021 and net-short futures positions (non-commercial traders) remain at their highest level since 2006, the slightest shift in sentiment could have wedding bells ringing again.
Please see below:
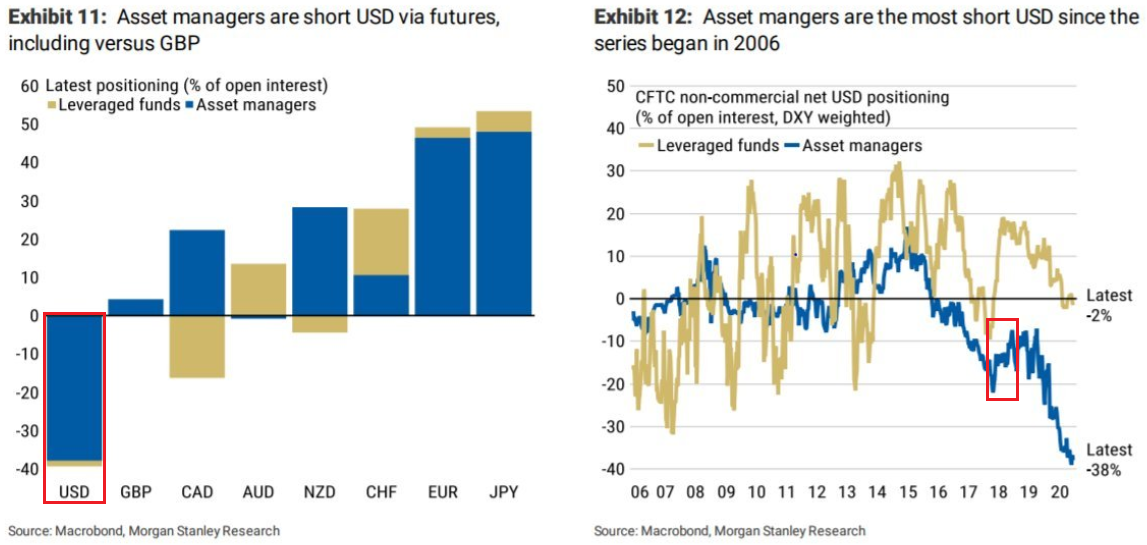
Figure 1 – Net-short Futures Positions
If you analyze the second red box (on the right side), you can see that the 2018 top in net-short futures positions ended with a violent short-covering rally, which propelled the USDX nearly 11% higher from trough to peak.
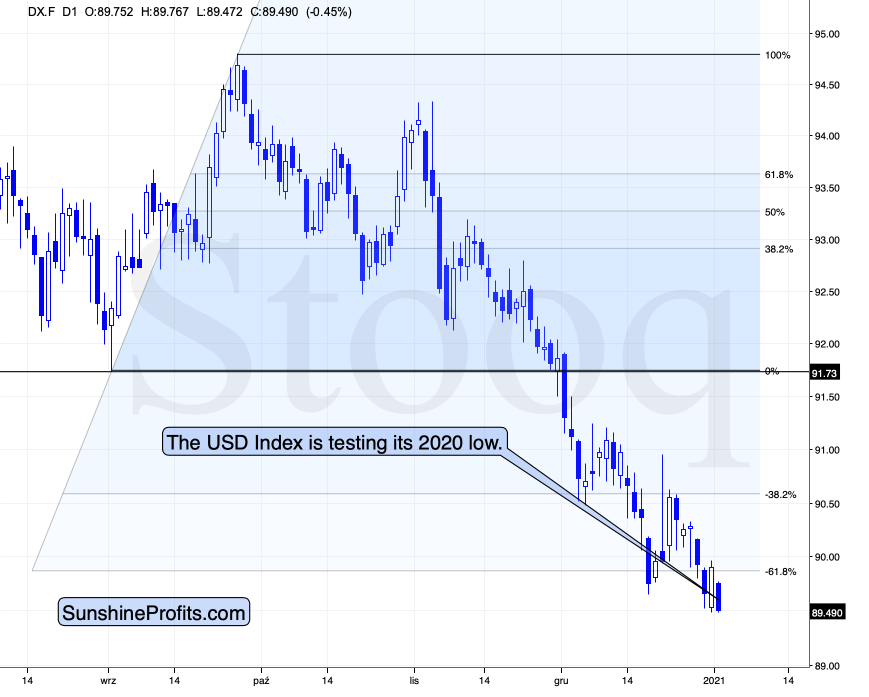
Figure 2 – U.S. Dollar Index
In this week’s early trading, the USDX moved lower, almost back to the 2020 lows. This was disappointing to anyone hoping that the December 31 rally was the beginning of a sharp rally, somewhat similar to what we saw in early September. In reality, the Dec. 31 rally and today’s decline don’t change much. It is not the immediate-term that is particularly important right now, but the medium and long-term pictures. The indications coming from them are much more decisive, and more important.
And while the USDX remains indecisive right now, its price action still follows a familiar playbook: In 2018, the USDX dipped below the 1.618 Fibonacci extension level before circling back with a vengeance (The initial bottom occurred in early 2018, with the final bottom not far behind.) Moreover, the 2018 USDX bottom also marked the 2018 top in gold, silver, and the gold miners (depicted in the below).

Figure 3 – USDX, USD, GOLD, GDX, and SPX Comparison
Also reprising its former role, the USDX’s RSI (Relative Strength Index) mirrors the double-bottom seen in 2017-2018 (the green arrows at the top-left of the chart). As the initial pattern emerged (with the RSI below 30 in 2017), it preceded a significant rally, with the USDX’s RSI surging to nearly 70. And just like the chorus from your favorite song, the pattern repeated in 2018 with nearly identical results.
Today, it’s more of the same.
If you look at the pattern at the top-right of the chart (the green arrows), the only difference is time. And in time, the USDX’s likely ascension will put significant pressure on gold, silver, and gold miners. In addition, the precious metals’ underperformance relative to the USDX further implies that a drawdown is the path of least resistance.
Moreover, let’s keep in mind the similarity in cryptocurrencies – we now have a parabolic upswing, just like what we saw in early 2018. The history does seem to be rhyming, and this doesn’t bode well for the stock market (there are some individual opportunities, e.g. Matthew Levy, CFA managed to reap great gains in the Taiwanese ETF – it gained over twice as much as the S&P since Dec. 3 ), as well as the precious metals market.
It appears that the USD Index is repeating its 2017 – 2018 decline to some extent. The starting points of the declines (horizontal red line) as well as the final high of the biggest correction are quite similar. The difference is that the recent correction was smaller than it was in 2017.
Since back in 2018, the USDX’s bottom was at about 1.618 Fibonacci extensions of the size of the correction, we could expect something similar to happen this time. Applying the above to the current situation would give us the proximity of the 90 level as the downside target.
“So, shouldn’t gold soar in this case?” – would be a valid question to ask.
Well, if the early 2018 pattern was being repeated, then let’s check what happened to precious metals and gold stocks at that time.
In short, they moved just a little higher after the USDX’s breakdown. I marked the moment when the U.S. currency broke below its previous (2017) bottom with a vertical line so that you can easily see what gold, silver, and GDX (proxy for mining stocks) were doing at that time. They were just before a major top. The bearish action that followed in the short term was particularly visible in the case of the miners.
Consequently, even if the USD Index is to decline further from here, then the implications are not particularly bullish for the precious metals market.
To summarize, gold’s recent strength is underpinned by a dormant U.S. dollar. But with the greenback more unloved than the villain in a superhero movie, it won’t take much to change the narrative. Furthermore, with net-short futures positions going from excessive to the extreme, the game of musical chairs is likely to end with the shorts capitulating and the USDX moving higher. The implications may be unclear for the next few days, but they are bearish for the next few weeks to months.
Thank you for reading our free analysis today. Please note that the above is just a small fraction of today’s all-encompassing Gold & Silver Trading Alert. The latter includes multiple ...
more

