
What Underperforms Gold And Heralds More Declines?
With the gold miners underperforming gold, and gold underperforming the USDX, it was only a matter of time before the house of cards came crashing down.
The writing has been on the wall all along with signs for all to see. On Jan. 5, I warned that the GDX was approaching an inflection point in the following way:
The GDX ETF managed to rally above its 50-day moving average – just as it did at its November top. Moreover, please take note of the spike in volume that we saw yesterday. There were very few cases when we saw something similar in the previous months, which was at the November high and at the July high, right before the final 2020 top. The implications are bearish.
And despite Friday’s (Jan. 8) 4.82% sell-off, the GDX’s last hurrah is likely to end with even more fireworks.
Please see the chart below:
(Click on image to enlarge)
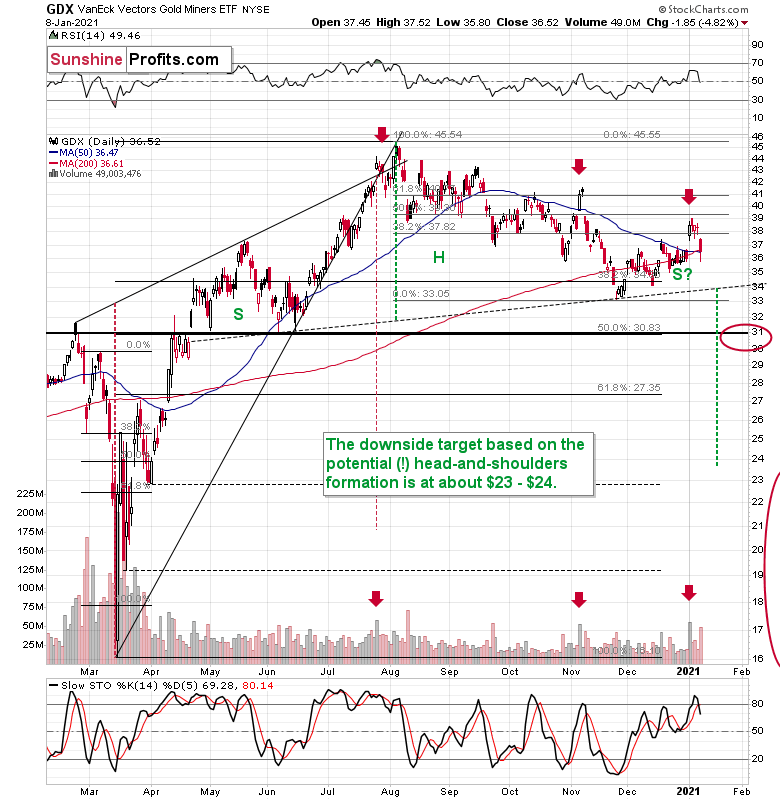
Figure 1 - VanEck Vectors Gold Miners ETF (GDX), GDX and Slow Stochastic Oscillator Chart Comparison – 2020
With technicals foretelling the decline, many bullion bulls closed their eyes to the plethora of warnings signs that you can find in the previous Gold & Silver Trading Alerts.
For example:
- A huge volume spike in the first session of 2021 was very similar to what we saw at the November 2020 and July 2020 tops – this heralded declines.
- The GDX’s stochastic oscillator bounced above 80, mirroring similar readings that preceded five pullbacks since September.
- Arguably the most important indication that keeps on flashing the very bearish signals, the GDX’s underperformance relative to gold remained intact.
In addition, the GDX is on the cusp of forming a head and shoulders pattern. If you analyze the chart above, the area on the left (marked S) represents the first shoulder, while the area in the middle (H) represents the head and the area on the right (second S) represents the potential second shoulder.
Right now, $33.7-$34 is the do-or-die area. If the GDX breaks below this (where the right shoulder forms) it could trigger a decline back to the $24 to $23 range (measured by the spread between the head and the neckline; marked with green).
Since there’s a significant support at about $31 in the form of the 50% retracement based on the 2020 rally and the February 2020 high, it seems that we might see the miners pause there. In fact, it wouldn’t be surprising to see a pullback from these levels to about $33, which could serve as the verification of the completion of the head-and-shoulder pattern. This might take place at the same time when gold corrects the decline to $1,700, but it’s too early to say with certainty.
Also, let’s not forget that the GDX ETF has recently invalidated the breakout above the 61.8% Fibonacci retracement based on the 2011 – 2016 decline.
(Click on image to enlarge)
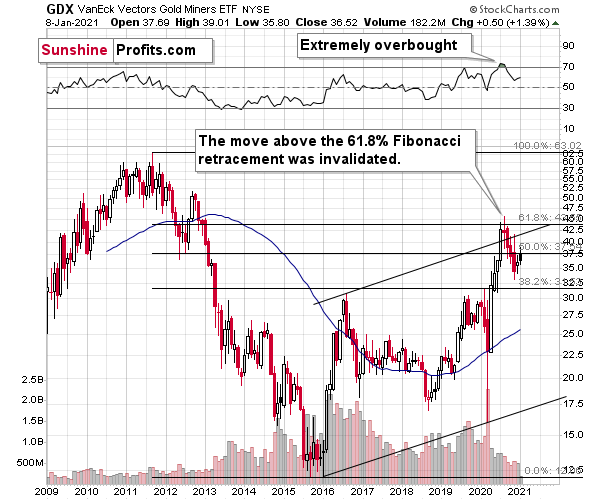
Figure 2 - GDX VanEck Vectors Gold Miners ETF (2009 – 2020)
When GDX approached its 38.2% Fibonacci retracement, it declined sharply – it was right after the 2016 top. Are we seeing the 2020 top right now? This is quite possible – PMs are likely to decline after the sharp upswing, and since there is just more than one month left before the year ends, it might be the case that they move north of the recent highs only in 2021.
Either way, miners’ inability to move above the 61.8% Fibonacci retracement level and their invalidation of the tiny breakout is a bearish sign.
The same goes for miners’ inability to stay above the rising support line – the line that’s parallel to the line based on the 2016 and 2020 lows.
In summary, the GDX’s train has likely gone off the rails, with silver in the front car and gold in the back. And as the technical derailment unfolds, a resurgent U.S. dollar is likely to accelerate the impact. Furthermore, if the S&P 500 hops on board – and declines from its current state of euphoria – damage to the precious metals mining stocks could be particularly violent.
Disclaimer: All essays, research, and information found on the Website represent the analyses and opinions of Mr. Radomski and Sunshine Profits' associates only. As such, it may prove wrong ...
more

