
What Copper: Gold Ratio & TNX Say About Global Economy Very Disappointing
There's a simple shortcut to tracking the health of the global economy. It's called the copper-to-gold ratio. On the surface, gold and copper prices don't seem to bear a direct relationship to each other yet this simple ratio is one of the untold wonders of market analysis. If you want to know how the global economy is doing let this simple indicator do the talking - and here is what it is saying these days.
Copper is an industrial metal. Demand increases during periods when economic output is rising. Gold is a store of value with limited industrial applications. These different uses of the metals have allowed the CGR to act as an accurate barometer of global growth.
The Copper:Gold ratio (CGR) is calculated by dividing the market price of copper by the market price of gold.
- A declining copper:gold ratio shows a weakening economy, while a rising ratio shows a strengthening economy.
- The secret to understanding this ratio is not its current value, however. What's much more important is the directional trend of the chart.
Below are charts of the price of copper since 2008, the price of gold during that same period and their relationship as per the CGR.
COPPER
(Click on image to enlarge)
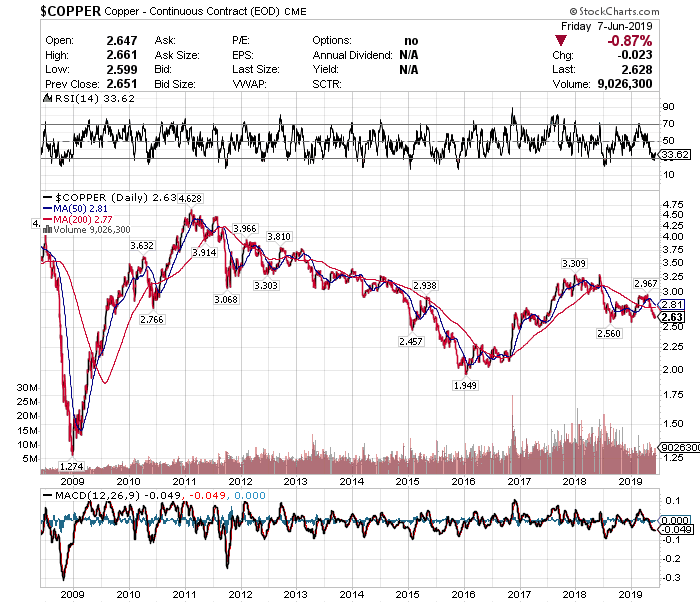
The price of copper:
- was UP 70% from January 2016 to the end of 2017 as China’s pace of growth picked up and the rest of the world economy boomed (economic expansion)
- but is DOWN 20% since then amid concerns over trade wars, U.S. fiscal and monetary policy, Brexit, the Italian debt situation and a possible slowdown in China (economic contraction).
GOLD
When gold prices are high it signals the economy is not healthy. Investors buy gold as protection from either an economic crisis or inflation. Low gold prices mean the economy is healthy. Investors have many other more profitable investments like stocks, bonds, or real estate.
(Click on image to enlarge)
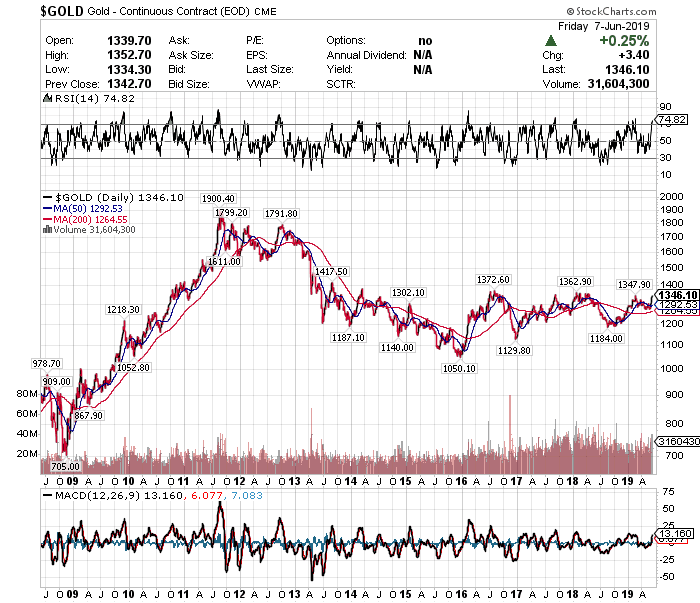
The price of gold:
- remained relatively unchanged from mid-2016 until the end of 2018 and
- has continued to remain relatively unchanged since then as well.
The fact that the price of gold has remained relatively unchanged over the past 5 years indicates that investors have been undecided as to the true state of the economy neither piling into gold as a safe haven from market uncertainty or selling out believing that there is minimal risk in investing in other assets such as equities and real estate.
COPPER: GOLD RATIO
(Click on image to enlarge)
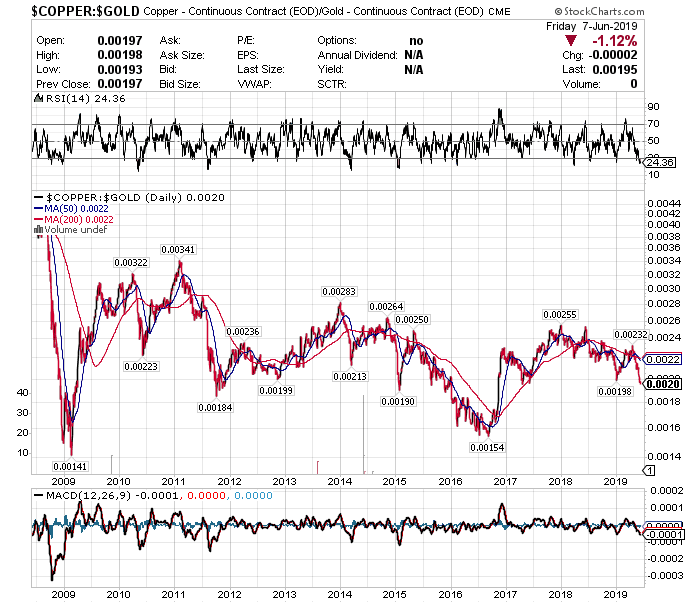
The CGR:
- was UP 66% from mid-2016 until the end of 2018 (economic expansion)
- but is DOWN 22% since then (economic contraction).
TNX
The yield on 10-year Treasury Notes (TNX) also tends to rise during economic expansion because investors’ inflation expectations are on the rise. The yield of the 10-year US Treasury bond is as follows:
(Click on image to enlarge)
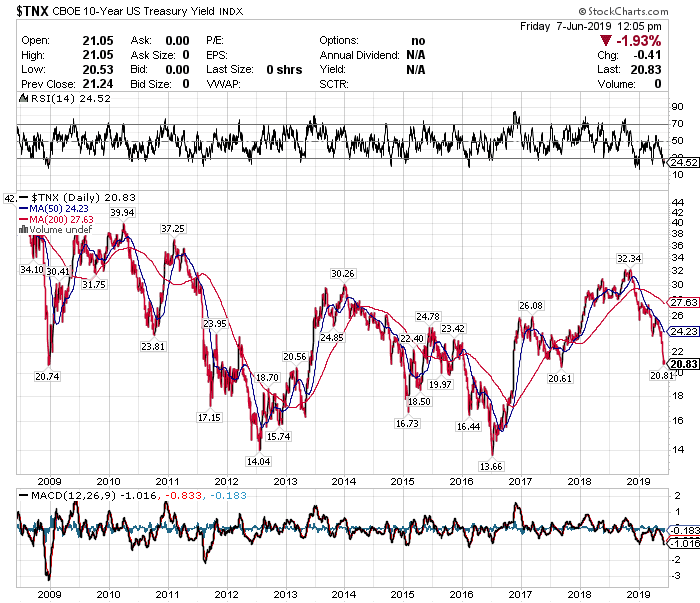
The TNX:
- was UP 137% from mid-2016 until November 2018 (economic expansion)
- but is DOWN 36% since then (economic contraction).
Conclusion
There should be a positive relationship between the copper-gold price ratio and 10-year yields. Both should be rising and falling based on the state of the world economy so the recent weakness of both the CGR and the TNX suggest that economic growth is weak going forward.
(Also listen to Here's why the copper/gold ratio is a key economic indicator in which Phil Streible of RJO Futures says gold and copper are the first markets he checks every morning.)


Makes sense, thanks.