
What China Knows About The Coronavirus That Oil Traders Don't Know
Yesterday, world-wide, one hundred-times more people died from malaria than died from COVID-19/coronavirus. But the economic cost from contagion is not human suffering; it is the restrictions on travel put in place to contain it.
Over nine months SARS infected 8,098 people, 774 died (9.6% fatality). Over the first few months of the COVID-19 contagion, 78,635 people were infected and 2,459 died (3.1% fatality). IEA is predicting a collapse in demand for oil.
What’s the cure?
Easy; stop flying, and don’t take public transport. Drive, with the windows closed and the ventilation on re-cycle. Don’t; whatever you do, book your dream cruise; and above all, stay out of jail.
I looked it up on Wikipedia. Apparently, in 2010, flying burned 2,691 British Thermal Units per passenger-mile, driving burned 4,218; 43% more.
This is what happened in China during the SARS travel lockdown which was in place for all of 2003 and 2004.
(Click on image to enlarge)
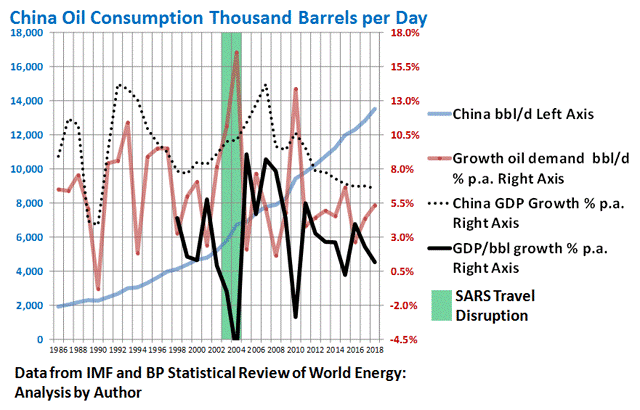
No wonder, today, when the whole world is cutting back oil deliveries, China has started to stockpile.
Story-line:
- There was a slowing in GDP growth from 2003 to 2004 (full year). But that was not “statistically significant” comparing to a dummy variable SARS-lockdown = 1, not = 0; either for annual data, or quarterly data (Prob>[t]=0.59).
- There was a huge jump in oil consumption, 11% year-on-year in 2003 and 16.5% in 2004: 30% over two years. That was borderline “statistically significant” for SARS-lockdown (1, 0) as an explanatory variable (Prob>[t]=0.0634).
- The reason for the huge growth, even when GDP growth was flat, was a massive drop in GDP-per-Barrel of oil consumed, by 1% in 2003 (from a trend of plus 3% per year), and by 5.5% in 2004, that was highly “statistically significant” (Prob>[t]<0.0001*).
- GDP per barrel is a measure of how efficiently oil is used. The travel disruptions compromised the efficiency of how oil was used in China to move people around.
An aside, the words “statistically significant” are, technically, meaningless; but everyone uses them. The correct wording is “null hypothesis, the probability that the drop in GDP-per-barrel in 2003 and 2004 was not linked to SARS is less than 10,000 to one”, which is a bit of a mouthful.
The analysis does not prove SARS, or more precisely, the travel-lockdowns to contain it, caused the drop in GDP/bbl, it simply says that the probability it wasn’t connected, is infinitesimally small.
Looking at the numbers a different way:
(Click on image to enlarge)
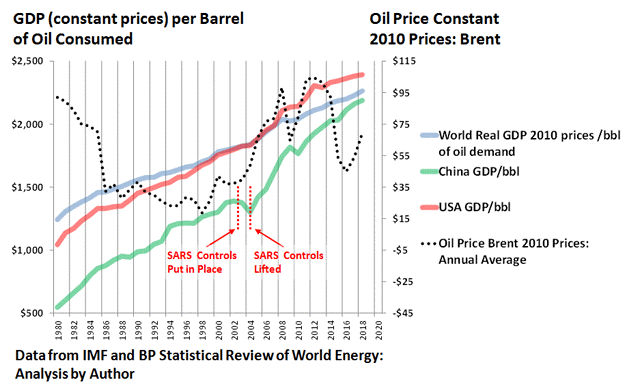
I never saw that chart before; I’ve been meaning to plot the numbers out for ten years. Glad I did, finally.
I have a theory that the starting point for most economic activity is burning oil, then there is trickle-down, so GDP/bbl is important for figuring the value of oil (another subject). Put that another way, imagine if there was no oil to burn, we would be heading back to live in caves.
What surprised me was how straight the lines are, and the steady growth; these days we get about double the amount of economic benefit from slowly destroying the planet, as we did forty-years-ago.
Another thing is that price doesn’t seem to affect the trajectory of the lines.
China has been catching up with the rest of the world in terms of efficiency. Seems like perhaps the increase in oil prices from 2004 to 2008 might have been because China found they could do more with a barrel of oil, so they could afford to pay more.
Back to the subject. Notice the kink down in the China line in 2003 and 2004?
In my opinion that was because SARS disrupted transportation in China, making the use of oil in the economy, less efficient, so more oil was required to keep the economy going.
That could make sense.
Whether the virus is SARS or COVID-19, or the next one, the response is to screen at airports and public transport. Apart from the hassle, I imagine many people avoid flying and public transport and drive instead, to avoid the risk of getting infected.
Or could that just be a blip, a chance event, like a black swan or butterflies flapping their wings in Brazil?
To check that out, I did some sums using multivariate cross-section regression analysis to build a model for COVID-19 based on what happened during the SARS lockdown.
Not many people are familiar with cross-section analysis; it’s the technique AggregateIQ used to analyze the data that was allegedly stolen from Facebook. I learned how to do it with a pencil, a blank piece of paper and a calculator (remember them), when I took a statistics module forty years ago; that was really painful.
Statisticians’ favorite hobby is boring people to death, I nearly committed suicide. These days there is software that does it, I use SAS-JMP.
I don’t normally show my calculation sheets but I’m anticipating a bit of pushback on this one.
After-all the head of BP recently said that it was “obvious” that the COVID-19 contagion would reduce oil consumption in China, and he thought by 300,000 to 400,000 barrels per day in 2020 was likely. The head of IEA predicted a drop of 450,000 barrels per day in Q1-2020, alone.
I’m saying it’s not at all obvious.
This is a summary of the results of my analysis, explained below:
(Click on image to enlarge)
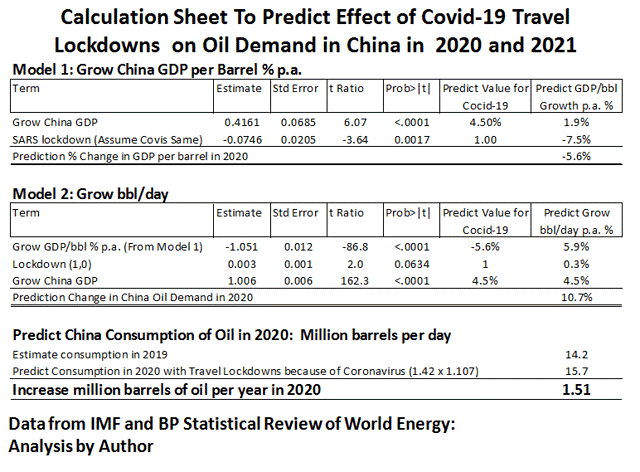
My prediction based on that analysis is that if the COVID-19 lockdown lasts two years, like SARS, then oil demand oil China will go up by an average of 1.5 million barrels per day (about 12% p.a.), in 2020 and 2021 (total 3.0 million barrels per day over two years).
So, as usual, I’m disagreeing with the experts.
In my last post, I suggested that U.S. shale oil production would not grow by 900,000 barrels per day, as predicted by IEA, EIA, Rystad Energy, and as implied by 42 experts polled by Reuters; and unless Brent goes up over $75, more likely it will drop by 200,000.
The experts are saying there will be a surplus of supply in 2020 of 1.3 million barrels per day.
I’m saying that in 2020 a total of 1.7 million barrels per day will need to be found, outside of shale oil.
So we differ by a total of three million barrels per day, and that's just if COVID-19 does not go global; if it does go global our difference of opinion will be in the order of 20 million. Now you understand why Reuters never asks me to contribute my (disagreeable) opinion to their polls.
Luckily OPEC is holding back some, but I’d be surprised if they settle for less than $90 Brent to open the tap, and that would not cover increased demand in 2021.
But perhaps this contagion, and the lockdown, will not last as long as SARS?
Lessons were learned during SARS, albeit the Chinese authorities had their heads in the sand at the start of COVID-19.
A vaccine is being tested, and the new Nano-95% (N-95) facemasks are supposedly much more effective than the surgical masks used during the SARS contagion. Interesting that many of those are made in China and Korea on machines exported from Iran in defiance of the sanctions.
Equally, it could go the other way.
If COID-19 does go global, I calculate about 9 million barrels per day of extra oil will need to be found, for every year a global lockdown lasts.
That would be catastrophic.
Bent could easily go over $200.
Explanation Of The Model
For anyone who won’t buy my line “I’ve been doing this for forty years so Trust Me”, here’s an explanation. Apologies in advance for being boring:
So, reading the calculation sheet, the formula for the change in oil demand in China is:
![]()
LkD (1, 0) means when there is a lockdown I put a dummy variable (1) in the column, when not I put zero.
In English:
Model 1:
- The best-fit (the estimate) says the SARS lockdown pushed down GDP/bbl by -0.0746 (7.4%) on average
- In fact GDP/bbl went down 1% in 2003 and 5.5% in 2004, average 3.25%
- But the model also says the growth in GDP also affects GDP/bbl, and on average a 1% increase in GDP, gives (over twenty years of data), a 0.416% increase in GDP/bbl, on average.
- In 2003 and 2004 GDP grew 10% so the model says GDP/bbl ought to have gone down 4.16% minus 7.46% = 3.3% which is about right
- “Predict Value” is my prediction for what will happen to the explanatory variables this time based on what was learned about SARS, the lockdown number is 1, GDP growth is predicted to be 4.5% (IMF’s latest number)
- Add up 1.9% minus 7.5% you get minus 5.5%
- So the model says the impact will be less this time, compared to SARS because China’s GDP is growing less. In other words, China has a lot to thank President Trump for, in terms of their likely oil-bill to clean up the mess, most probably started in their biological warfare unit in Wuhan.
Model 2:
- The prediction for change of GDP/bbl in 2020 (4.7%) goes in the "Predict Value" box
- The best-fit over ten years says a lockdown increases total oil demand by 0.003 (0.3%), so the main thing is the change of GDP/bbl
- A 1% increase in GDP gives a 1.006% increase in oil demand
- Add those up and you get a prediction for the change in oil demand on average over two years (2020 and 2021)
- In SARS the growth in demand was more in 2004 (16.5%) than in 2003 (11.2%), so I guess that might be how it plays out in 2020 and 2021, although that’s a complete guess, I have no basis for that, outside of “If History Rhymes”.
- So my prediction, China's oil consumption/demand will go up 8.6% in 2020 and 12.7% in 2021.
- The reason (according to this analysis) why the growth of oil demand will be lower (as a percentage) in 2020 and 2021, is because GDP/bbl (a measure of the efficiency of using oil), is 50% higher than it was in 2003.
- GDP/bbl in Europe is about twice that of China and the USA, so if the contagion spreads there, the effect on oil demand will likely be 50%.
This is the model compared to actual for twenty years (1998 to 2018):
(Click on image to enlarge)

The model is pretty lousy for predicting what oil consumption/demand will be next year or any year in the future, but reasonably good for predicting what SARS did (RSquare 43%m that means on average 43% of differences in actual year-on-year can be explained by the predictor model).
What the plot says is normally oil demand in China grows about 4.7% per year, except when there is a coronavirus lockdown, and by-the-way, over the past twenty years, oil consumption/demand in China never grew less than 2% per year. Prob>[t]= 0.0006%, that's pretty good, for government work.
I worked out the plus or minus on that by doing a Monte Carlo.
That’s when you multiply each of the various standard errors for each estimate in the model by a random number varying from 2-to-minus 2 (two standard errors gives the 95% confidence limit); to get an idea of the accuracy of the predictor model. I learned how to do that working on a toxic asset assembly line in 2001.
(Click on image to enlarge)
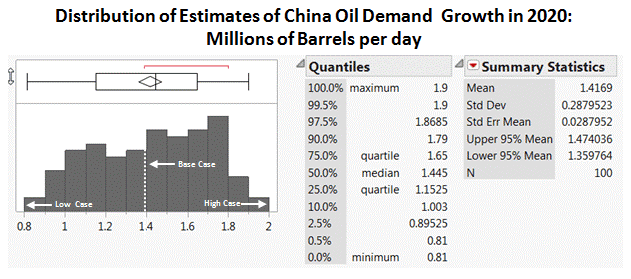
So, not a particularly precise prediction, average 1.4 million barrels per day, plus or minus 600,000 barrels per day, at the 95% confidence limit.
My analysis may be totally wrong, but at least it’s transparent.
If China’s oil demand goes up by the numbers the analysis predicts, and also shale oil production drops in 2020, as I predicted in my previous post, there will be a shortage of oil.
Brent could go over $100.
Why $100?
Well, that’s the number that in the past started to produce demand-destruction in China.
If COVID-19 goes global, the model predicts total demand could go up by 9-million barrels per day, plus or minus 3.8-million at the 95% confidence limit.
Even the “best case” number of 5.2 million barrels per day would be catastrophic.
Like $200 Brent.
Message in the bottle; don’t sell the offshore E&P stocks I suggested you might take a flutter on, before the latest coronavirus hit, just yet.
Bigger picture, oil prices are much too low, offshore E&P has stalled, shale is dying and needs at least $75 Brent to revive, the world is heating up (some say oil has nothing to do with that, but why take a chance?)
The possible impact of the contagion illustrates how vulnerable the world is to a major disruption in oil supplies.
It would make a lot of sense if world leaders agreed that there should always be a big cushion (10% of demand), just in case.
To achieve that they would need to control supply (along with OPEC), to make sure the price never goes down below $90, which is the price demand destruction seems to start and is what I figure is the intrinsic/fundamental value of oil, today.
The quickest way to reduce oil consumption, increase the efficiency of using oil, and perhaps save the planet, is to start some demand destruction.
Perhaps the latest coronavirus contagion will prove to have been a blessing in disguise? Certainly, it's a message.
Disclosure: I/we have no positions in any stocks mentioned, and no plans to initiate any positions within the next 72 hours.
The above is a matter of opinion provided ...
more

