
Watch Silver Vs. Gold For Market Direction
One of the points made in my previous article (A Path Toward Inflation) was that among several indicators of what I have been calling an "inflation trade" the Silver-Gold ratio was likely to be an early one. This is based on theory (silver having more commodity characteristics relative to gold's main utility as a monetary asset) and it is based on history, per the above linked article.
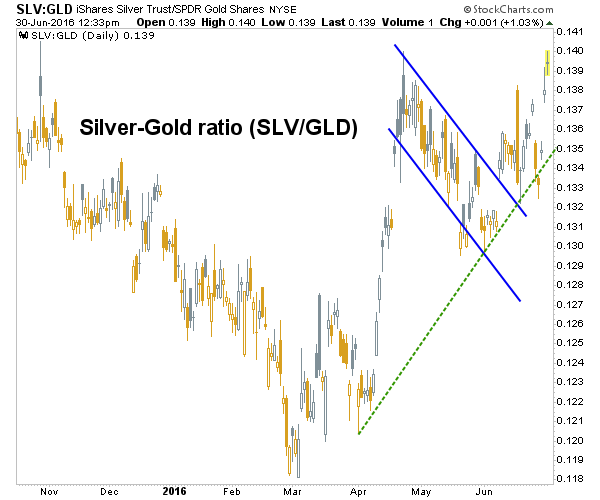
So today, exclusively for TalkMarkets readers, I would like to update two charts we follow routinely in NFTRH. First, the daily chart of the Silver-Gold ratio (using SLV-GLD). The ratio failed to break down with the Brexit hysteria and that was a bullish divergence in favor of an inflationary growth phase to come in many financial markets, with commodities the key asset class.
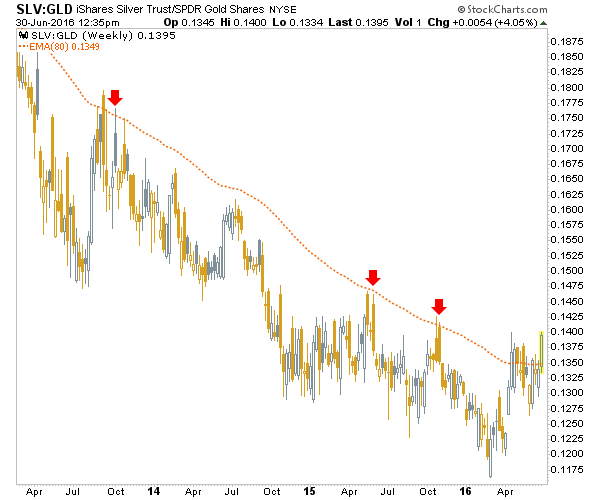
The weekly view shows why this failure to break down was so important. If things remain as they are and the Silver-Gold ratio remains above the weekly EMA 80, which defined the ratio's bear market, a trend change would be indicated. That trend change would be toward an inflationary environment, conveniently (for well positioned speculators) against the herds currently fleeing deflation and huddled in Treasury and government bonds.
Disclosure: Subscribe to more


