
Volume Price Analysis Reveals The Truth Behind The Price Action For Gold
(Click on image to enlarge)
Regular readers of my books and posts will know that volume price analysis has been the foundation of all my trading and investing over the last twenty years or so. I consider myself to be one of those fortunate traders who avoided the costly journey searching for a methodology with which to see inside the market. It’s where I began and so avoided all the pain (and expense) of trying out a multiplicity of approaches and the daily chart for gold is a classic case of the application of volume price analysis and how it reveals where the market is heading next. In my last post on gold on the 11th of August, I covered the plunge in the price of the precious metal but which was associated with volume which was out of agreement with the price action. In other words, it was anomalous and as such we should expect to see gold recover and return to the volume point of control at $1805 per ounce. Here’s an extract from the post:
“Moving forward we can expect to see a period of consolidation within the range of the candle before gold recovers, and more likely moves back to retest the VPOC at $1805 per ounce in due course.
Where next for the price of gold?
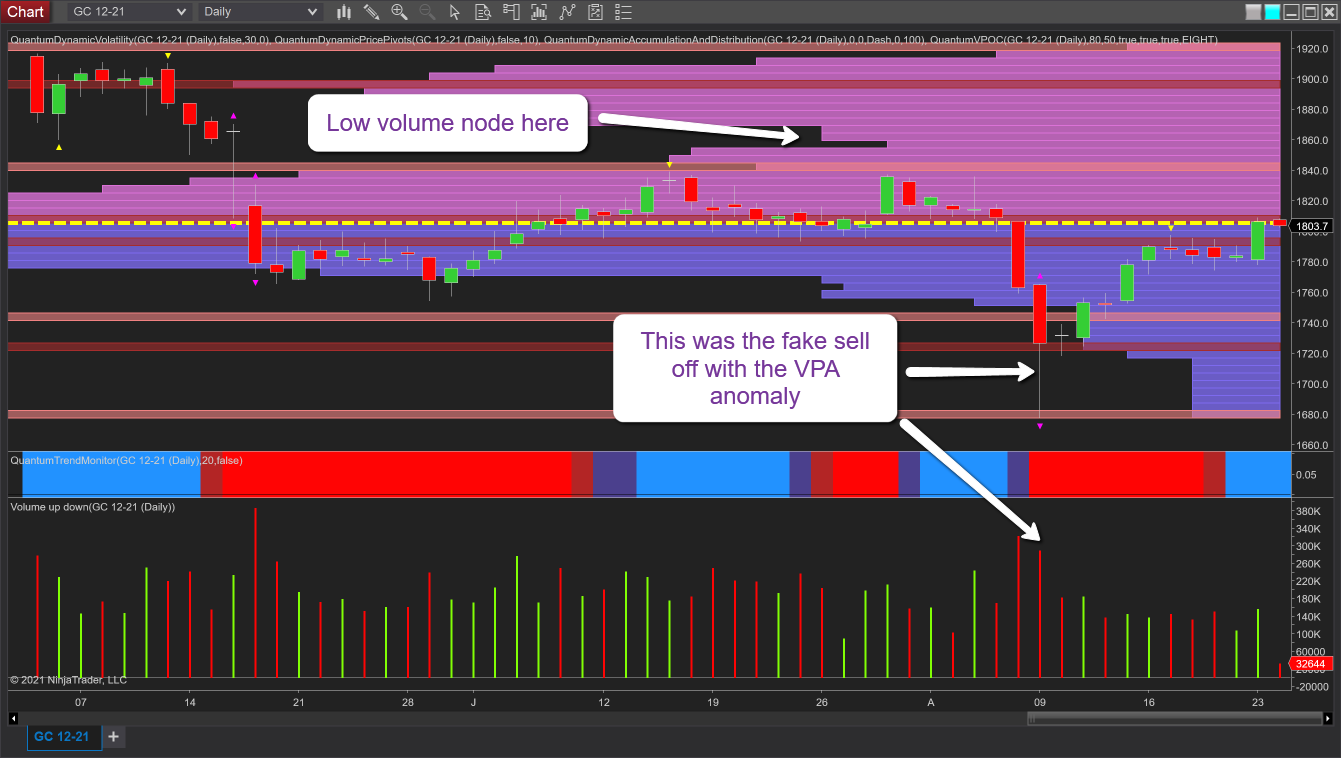
And so as we consider the daily chart for gold of the 24th August, what do we see? As expected the precious metal has indeed recovered from the fake sell-off and returned to the volume point of control to currently trade at $1804 per ounce at the time of writing. Yesterday’s price action closed with a wide spread up candle on good volume with price and volume in agreement. But as always, the question is where next for gold, and given we are at the VPOC itself as denoted with the yellow dashed line, then we can expect to see consolidation at this level in the short term with the price oscillating around the $1800 per ounce region.
Thereafter, for a continuation of bullish momentum, $1840 per ounce is the next important level as this is where we have the development of a low volume node on the VPOC histogram and if the price of gold reaches this level, it will be an easy move through to $1870 per ounce. So, in the short term expect to see congestion develop as we saw in July, and once we are out of the summer doldrums next month, volumes will increase and give gold the opportunity to continue higher supported with good volume.
Disclaimer: Futures, stocks, and spot currency trading have large potential rewards, but also large potential risk. You must be aware of the risks and be willing to accept them in order to invest in ...
more

