Using Copper As An Indicator Of Market Strength
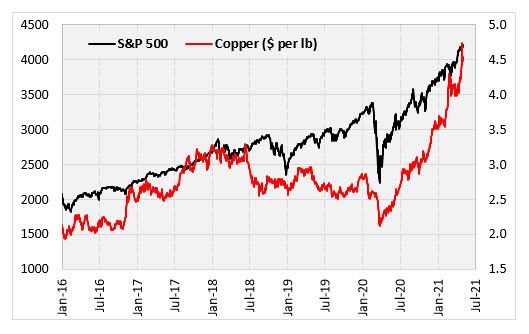
Copper has been rallying alongside stocks over the past year and recently hit its highest level ever. The metal is used for many things, including factories, electronics, and power generation. Because of its wide use across many sectors, copper is often considered a leading indicator for economic activity. Naturally, this could be an argument for higher stock prices going forward. This week I am looking at historical copper prices to see if a bullish copper market tends to lead to a bullish stock market, especially when stocks were already performing well.
STOCKS AND COPPER AT ALL-TIME HIGH
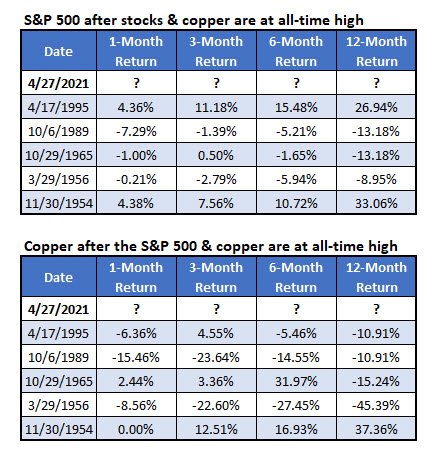
The tables below show how the S&P 500 Index (SPX) and copper performed after both were within a percent of their all-time high (it had to be the first occurrence in a year). This just signaled last week for the first time since 1995. That was a great time to buy stocks, as the S&P 500 gained 27% over the next year. The copper rally was a good indicator. Copper itself, on the other hand, had topped out and fell by 11% over the next year.
The three signals before the last one played out differently. Stocks struggled mightily after those signals, falling 13% after two of those signals, and falling 9% after the other one. Overall, stocks were very strong after two signals and weak after the other three. Copper prices dropped by double-digits after four of five signals.
STOCKS AND COPPER UP YEAR-TO-DATE
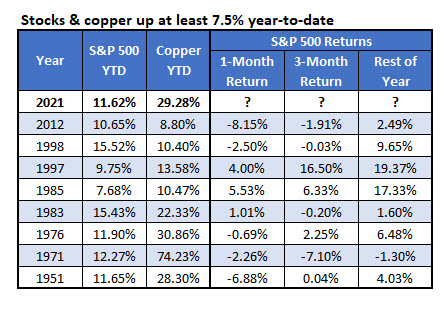
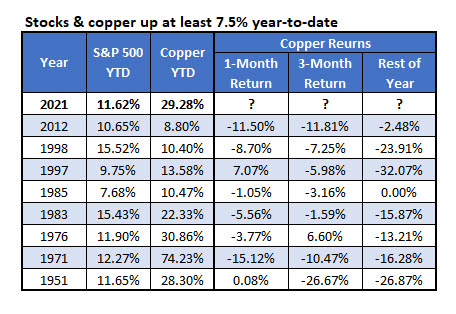
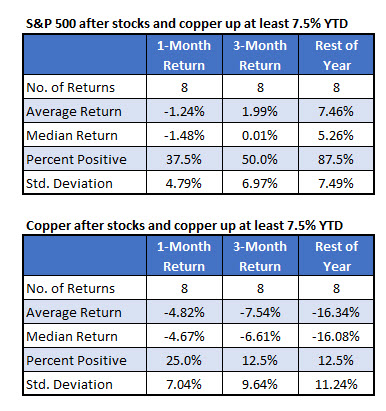
I also looked at this on a year-to-date basis. The S&P 500 Index is up about 10% in 2021 while copper has gained almost 30%. I went back to 1950 and found times in which the S&P 500 and copper were both up at least 7.5% on the year at this point. The tables below summarize how stocks and copper did over the next month, three months, and rest of the year.
In the eight instances, stocks tended to struggle early on, losing an average of 1.24% over the next month with just 38% of the returns positive. For the rest of the year, however, stocks tended to be strong. The S&P 500 averaged a gain of about 7.5% with seven out of eight returns positive.
The second table below summarizes the returns for copper. The rest of the year tended to be bad for copper in these years. Copper was positive just one time over the rest of the year and averaged a loss of 16% per year.
Finally, I have tables with the specific years where stocks and copper gained at least 7.5% at a similar point in the year and how they performed going forward.
