
USDX: Trick Or Treat, Looks Like An Early Halloween
The FED has recently been tricked with its own money. Could the central bank’s scary reverse repos become a treat for the USDX?
The USD Index (USDX)
With the ghosts of 2015 attempting to scare the U.S. Federal Reserve (FED) into tapering its asset purchases, the latest reverse repo nightmare could be gold, silver and mining stocks version of the boogeyman. Case in point: with the liquidity fright helping the USD Index sleep better at night, the greenback should benefit from the FED’s latest house of horrors: And with the central bank’s daily reverse repos hitting an all-time high of $485 billion on May 27 (with another $479 billion sold on May 28), Halloween may come early this year.
Please see below:
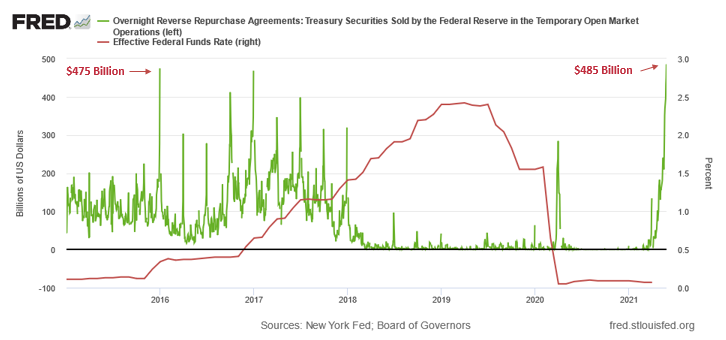
To explain, the green line above tracks the daily reverse repo transactions executed by the FED, while the red line above tracks the federal funds rate. If you focus your attention on the red line, you can see that after the $400 billion level was breached in December 2015, the FED’s rate-hike cycle began. Thus, with current inflation dwarfing 2015 levels and U.S. banks practically throwing cash at the FED, is this time really different?
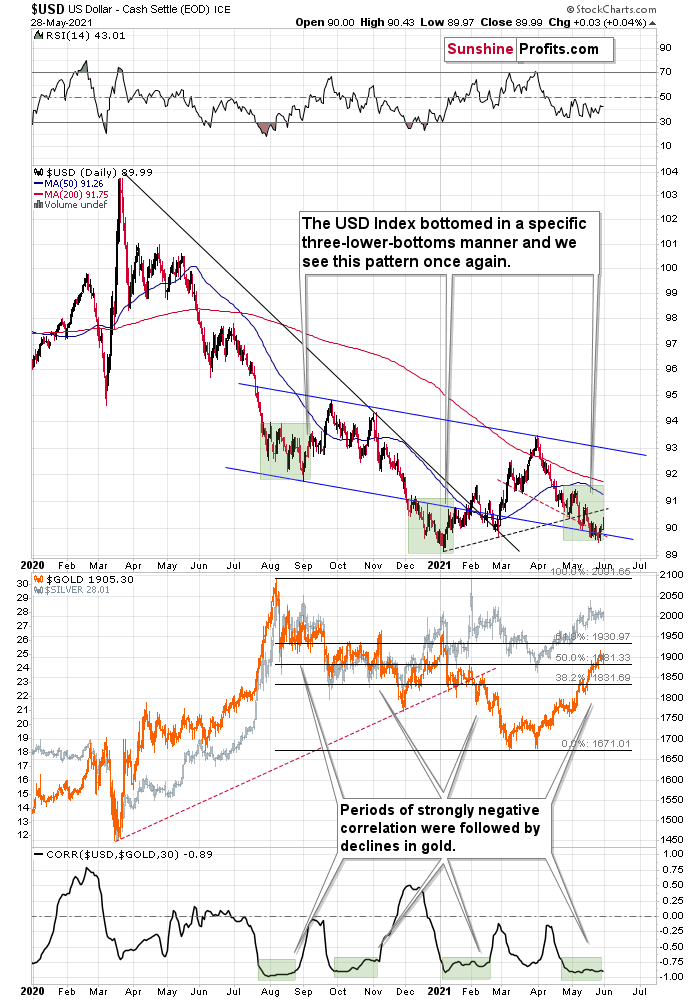
Likewise, with reduced liquidity poised to bolster the USD Index, not only are the fundamentals trending up but also the technicals. The USD Index jumped above its declining resistance line based on May’s highs, as well as the declining resistance line that started with the late-March high. This is important not only (and not primarily) because of the double-breakout. It’s important and particularly bullish, as it emphasizes that the third – and quite likely the final – short-term bottom in a row is already in.
In addition, the USD Index might be in the early innings of forming an inverted head & shoulders pattern. For context, an inverted H&S pattern is a bullish development that if formed, could usher the USD Index well above 94.5 (to about 97-98). However, completing the right shoulder requires an upward breach of 93 (the blue line), so at this point, it’s more of an indication than a confirmation.
Please see below:
For more context, I wrote previously:
This week’s move lower is a continuation, and most likely the final part, of a specific multi-bottom pattern that the USD Index exhibited recently.
I marked those situations with green. The thing is that the U.S. currency first declined practically without any corrections, but at some point it started to move back and forth while making new lows. The third distinctive bottom was the final one. Interestingly, the continuous decline took place for about a month, and the back-and-forth declines took another month (approximately). In July 2020, the USDX fell like a rock, and in August it moved back and forth while still declining. In November 2020, the USDX fell like a rock (there was one exception), and in December it moved back and forth while still declining.
Ever since the final days of March, we’ve seen the same thing all over again. The USD Index fell like a rock in April, and in May we’ve seen back-and-forth movement with lower lows and lower highs.
What we see right now is the third of the distinctive lows that previously marked the end of the declines.
And what did gold do when the USD Index rallied then?
In August, gold topped without waiting for USD’s final bottom – which is natural, given how extremely overbought it was in the short term.
In early January, gold topped (which was much more similar to the current situation given the preceding price action) when the USDX formed its third, final distinctive bottom.
I received a few questions recently asking what would need to happen for me to change my mind on the precious metals sector’s outlook. There are multiple reasons, and it’s impossible to list all of them. However, one of the reasons that would make me strongly consider that the outlook has indeed changed (at least for the short term) would be a confirmed breakdown in the USD Index below the 2021 lows to which gold would actually react.
As further evidence, the Euro Index might be in the midst of forming a bearish H&S pattern. If you analyze the right side of the chart below, you can see that the symmetrical pattern has the current rally mirroring the summer of 2020. And while we’re still in the early innings of forming the right shoulder, three peaks were recorded during the second half of 2020 before the Euro Index eventually rolled over. Likewise, with a symmetrical setup that seems to already be in motion, the Euro Index may be heading down a similar path of historical ruin. In the second half of 2020, the decline was not that big, but it’s no wonder that this was the case as that was only the left shoulder of the pattern. Completion of the right shoulder, however, would imply another move lower, at least equal to the size of the head – to about the June 2020 lows or lower.
Gold and the Euro
Furthermore, last week’s decline actually ushered the Euro Index back below the dashed resistance line of its monthly channel. And with its recent triple top mirroring the price action we witnessed in mid-to-late 2020 – before the Euro Index plunged – it won’t take long for confidence to turn into fear.
Please see below:
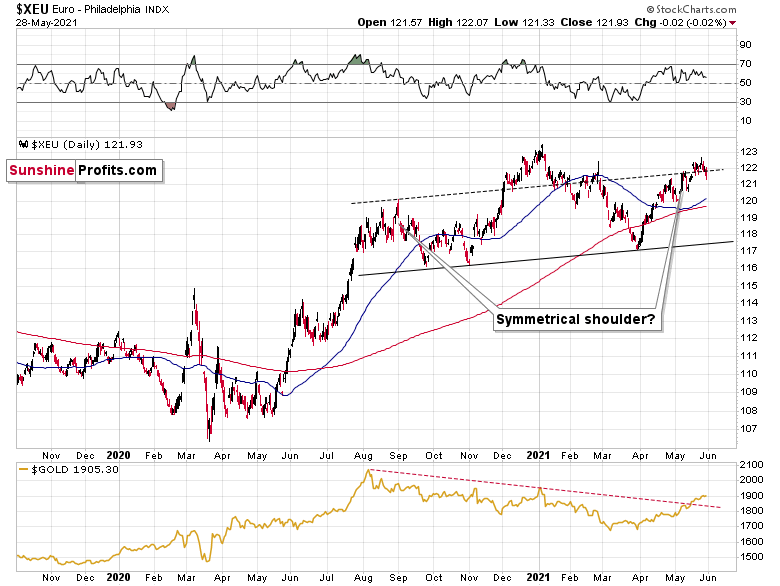
More importantly, though, the completion of the masterpiece could have a profound impact on gold, silver and mining stocks. To explain, gold continues to underperform the euro. If you analyze the bottom half of the chart above, you can see that material upswings in the Euro Index have resulted in diminishing marginal returns for the yellow metal. Thus, the relative weakness is an ominous sign, and if the Euro Index reverses, it could weigh heavily on the precious metals over the medium term.
If that wasn’t enough, with the USD Index hopping in the time machine and setting the dial to 2016, a bullish pattern is slowly emerging. To explain, I wrote on May 11:
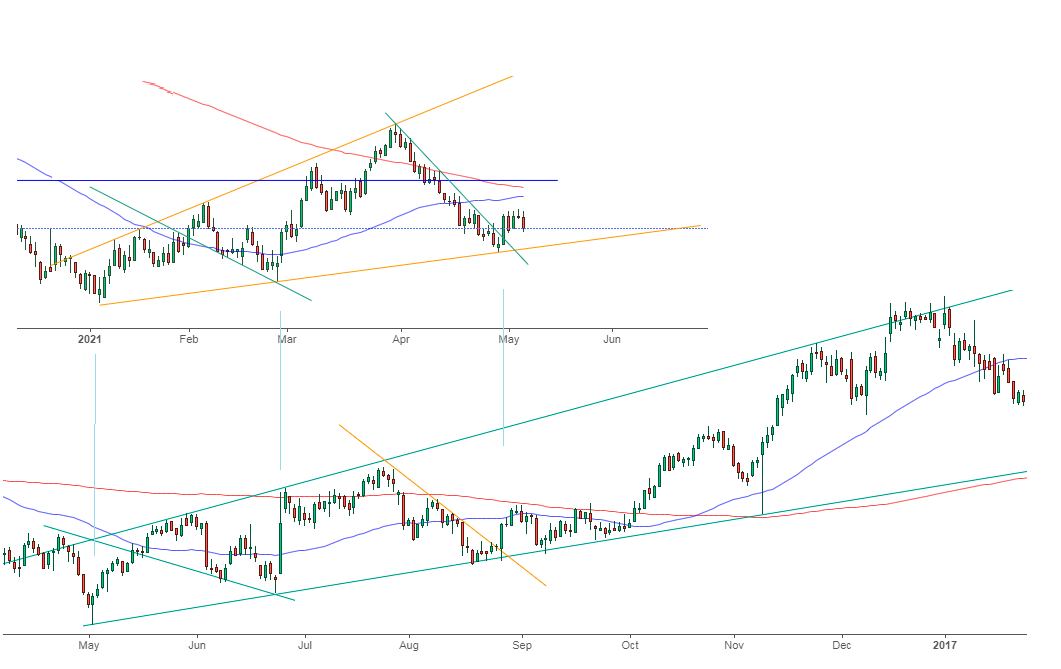
While the self-similarity to 2018 in the USD Index is not as clear as it used to be (it did guide the USDX for many weeks, though), there is also another self-similar pattern that seems more applicable now. One of my subscribers noticed that and decided to share it with us (thanks, Maciej!).
Here’s the quote, the chart, and my reply:
“Thank you very much for your comprehensive daily Gold Trading Reports that I am gladly admitting I enjoy a lot. While I was analyzing recent USD performance, (DX) I have spotted one pattern that I would like to validate with you if you see any relevance of it. I have noticed the DX Index performing exactly in the same manner in a time frame between Jan. 1, 2021 and now as the one that started in May 2016 and continued towards Aug. 16. The interesting part is not only that the patterns are almost identical, but also their temporary peeks and bottoms are spotting in the same points. Additionally, 50 daily MA line is almost copied in. Also, 200 MA location versus 50 MA is almost identical too. If the patterns continue to copy themselves in the way they did during the last 4 months, we can expect USD to go sideways in May (and dropping to the area of 90,500 within the next 3 days) and then start growing in June… which in general would be in line with your analysis too.
Please note the below indices comparison (the lower represents the period between May-Dec 2016 and higher Jan – May 2021). I am very much interested in your opinion.
Thank you in advance.”
And here’s what I wrote in reply:
“Thanks, I think that’s an excellent observation! I read it only today (Monday), so I see that the bearish note for the immediate term was already realized more or less in tune with the self-similar pattern. The USDX moved a bit lower, but it doesn’t change that much. The key detail here would be that the USDX is unlikely to decline much lower, and instead, it’s likely to start a massive rally in the next several months - that would be in perfect tune with my other charts/points.
I wouldn’t bet on the patterns being identical in the very near term, though, just like the late June 2016 and early March 2021 weren’t that similar.
As soon as the USD Index rallies back above the rising support line, the analogy to 2016 will be quite clear once again –the implications will be even more bullish for the USDX and bearish for the precious metals market for the next several months.”
Please note that back in 2016, there were several re-tests of the rising support line and tiny breakdowns below it before the USD Index rallied. Consequently, the current short-term move lower is not really concerning, and forecasting gold at much higher levels because of it might be misleading. I wouldn’t bet on the silver bullish forecast either. The white metal might outperform at the very end of the rally, but it has already done so recently on a very short-term basis, so we don’t have to see this signal. And given the current situation in the general stock market – which might have already topped – silver and mining stocks might not be able to show strength relative to gold at all.
On top of that, the USD Index’s long-term breakout remains intact. And when analyzing from a bird’s-eye view, the greenback’s recent weakness is largely inconsequential.
Please see below:
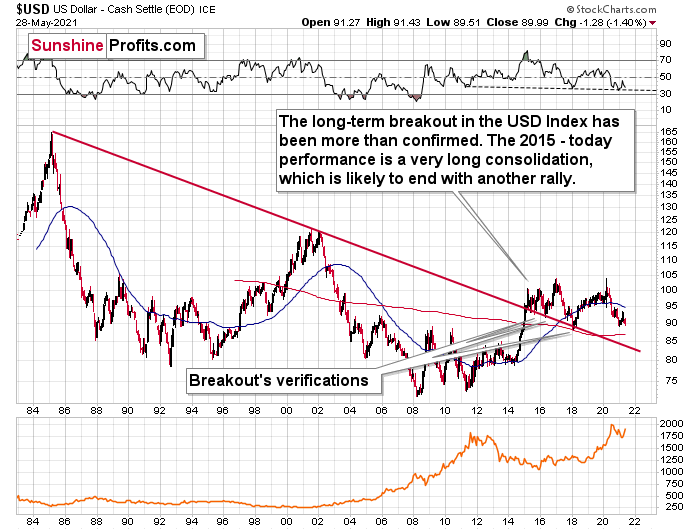
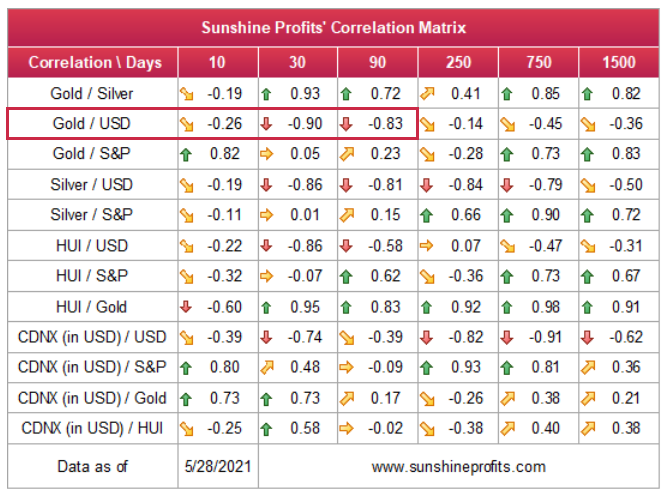
Moreover, please note that the correlation between the USD Index and gold is now strongly negative (-0.90 over the last 30 days) and it’s been the case for several weeks now. The same thing happened in early January 2021 and in late July – August 2020; these were major tops in gold.
The bottom line?
After regaining its composure, ~94.5 is likely the USD Index’s first stop. In the months to follow, the USDX will likely exceed 100 at some point over the medium or long term.
Keep in mind though: we’re not bullish on the greenback because of the U.S.’ absolute outperformance. It’s because the region is doing (and likely to do) better than the Eurozone and Japan, and it’s this relative outperformance that matters, not the strength of just one single country or monetary area. After all, the USD Index is a weighted average of currency exchange rates and the latter move on a relative basis.
In conclusion, ghouls, goblins and ghosts are popping up everywhere, and while the USD Index has been under investors’ negative spell, the curse may have just been broken. Moreover, with plenty of skeletons in the financial markets’ closet and liquidity slowly being drained from the system, the narrative of excessive money printing has become an old wives’ tale. More importantly, though, with the greenback finding technical support at roughly the same time, we could be witnessing a paradigm shift in U.S. dollar sentiment. The bottom line? With gold, silver and mining stocks benefiting from the USD Index’s recent struggles, a coven is gathering, and it will likely torch the precious metals over the medium term.
Disclaimer: All essays, research and information found on the Website represent the analyses and opinions of Mr. Radomski and Sunshine Profits' associates only. As such, it may prove wrong ...
more

