
USDX, Gold: We May Have Reached The Top Of The Mountain
Given the negative correlation between gold and the USDX, the former should have rallied today, but it didn’t. Have we reached the top with only one way out?
Let’s start today’s (May 25) analysis with something that’s happening right now, at the moment of writing these words. The USD Index is moving lower, below the recent lows. It’s currently trading at about 89.6, which means that after a few days of back-and-forth trading, it moved down once again – and (from the short-term point of view) quite visibly so.
What did gold do in response? It slid by 0.04%, which is a way of saying that it didn’t do anything. It should have rallied and broken above the recent highs. It didn’t, which indicates that the rally is likely over or about to be over. But let’s get back to the USD Index.
The Fight Between Gold and the USDX
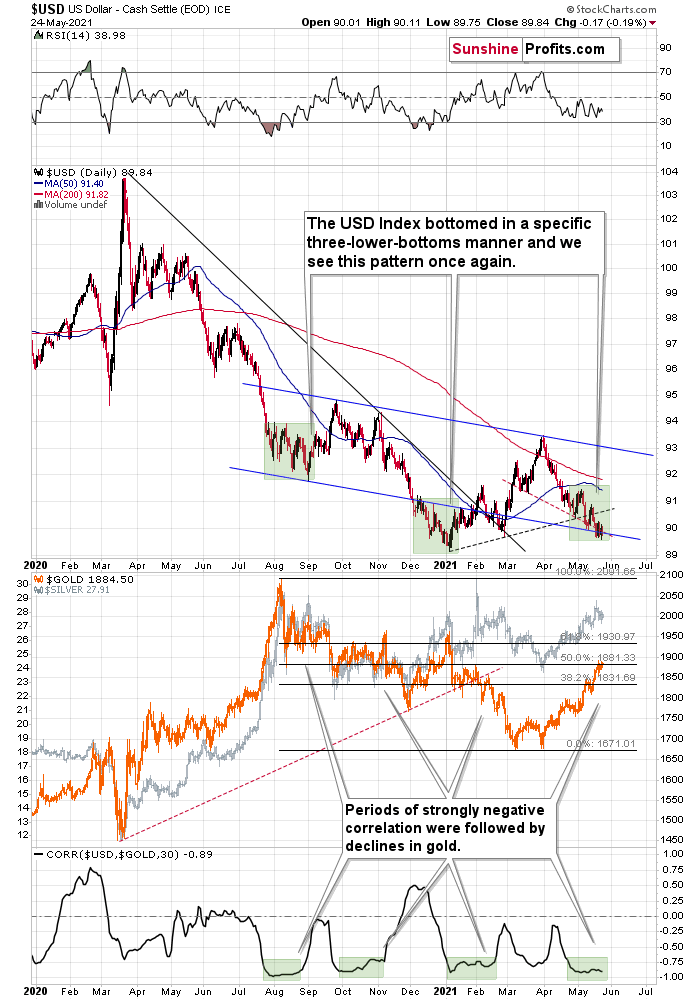
Today’s move lower is a continuation, and most likely the final part, of a specific multi-bottom pattern that the USD Index exhibited recently.
I marked those situations with green. The thing is that the U.S. currency first declined practically without any corrections, but at some point it started to move back and forth while making new lows. The third distinctive bottom was the final one. Interestingly, the continuous decline took place for about a month, and the back-and-forth declines took another month (approximately). In July 2020, the USDX fell like a rock, and in August it moved back and forth while still declining. In November 2020, the USDX fell like a rock (there was one exception), and in December it moved back and forth while still declining.
Ever since the final days of March, we’ve seen the same thing all over again. The USD Index fell like a rock in April, and in May we’ve seen back-and-forth movement with lower lows and lower highs.
What we see right now is the third of the distinctive lows that previously marked the end of the declines.
And what did gold do when the USD Index rallied then?
In August, gold topped without waiting for USD’s final bottom – which is natural, given how extremely overbought it was in the short term.
In early January, gold topped (which was much more similar to the current situation given the preceding price action) when the USDX formed its third, final distinctive bottom.
The USD Index is after a two-month decline, half of which was the back-and-forth kind of decline. It’s forming the third – and likely the final – bottom, and gold just refused to react positively to this situation in today’s pre-market trading.
This might be “it” – the markets might be forming their final reversals here, starting to follow the most bearish (in the case of gold) part of the analogy to the price action in 2008 and 2012.
Gold seems to be insisting on repeating – to some extent – its 2012 performance, and – to some extent – its 2008 performance. Either way, it seems that gold is about to slide.
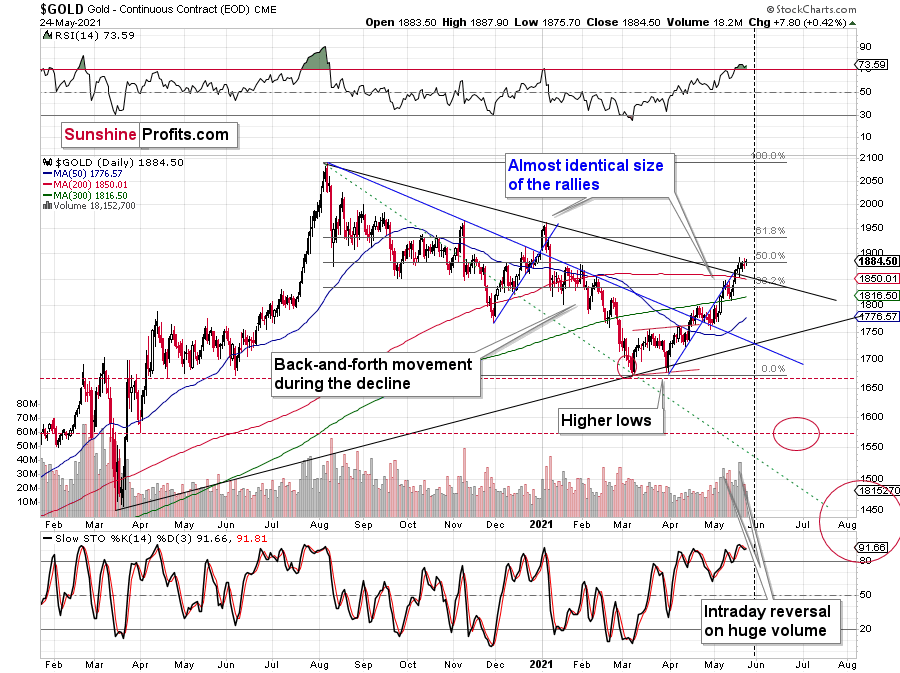
The reversal in gold took place after gold moved very close to its mid-January highs and the 50% Fibonacci retracement based on the August 2020 – March 2021 decline.
The sizes of the current rally (taking the second March bottom as the starting point) and the rally that ended at the beginning of this year are practically identical at the moment.
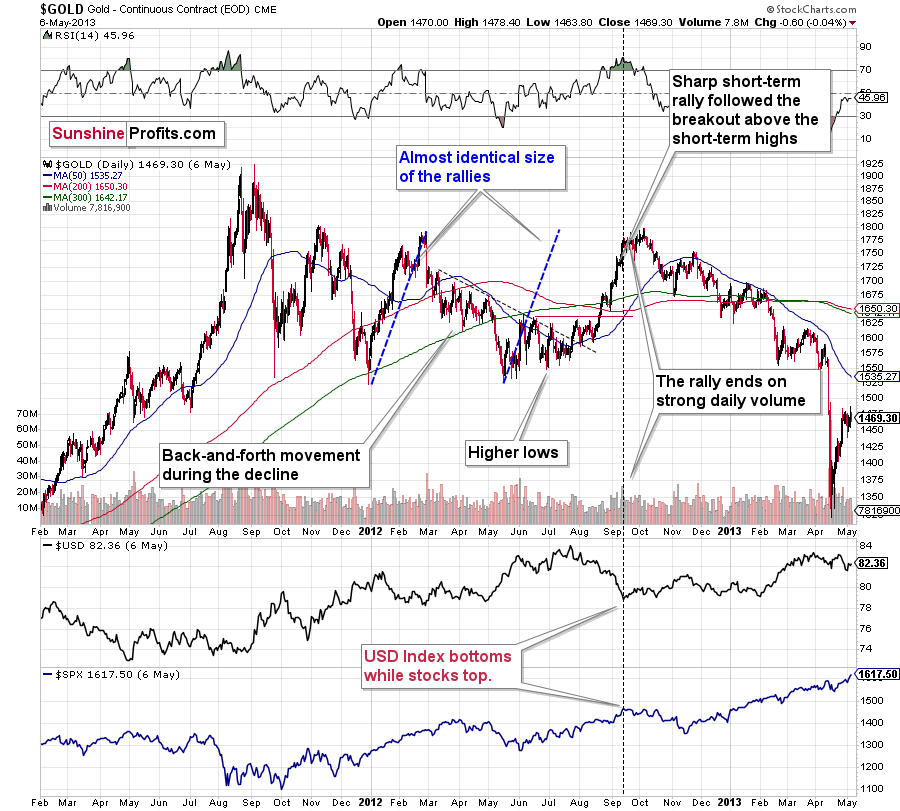
Just as the rallies from early 2012 and late 2012 (marked with blue) were almost identical, the same could happen now.
The March 2021 low formed well below the previous low, but as far as other things are concerned, the current situation is similar to what happened in 2012.
The relatively broad bottom with higher lows is what preceded both final short-term rallies – the current one, and the 2012 one. Their shape as well as the shape of the decline that preceded these broad bottoms is very similar. In both cases, the preceding decline had some back-and-forth trading in its middle, and the final rally picked up pace after breaking above the initial short-term high.
Interestingly, the 2012 rally ended on huge volume, which is exactly what we saw also on May 19 this year. Consequently, forecasting much higher gold prices here doesn’t seem to be justified based on the historical analogies.
The lower part of the above chart shows how the USD Index and the general stock market performed when gold ended its late-2012 rally and was starting its epic decline. In short, that was when the USD Index bottomed, and when the general stock market topped.

Back in 2008, gold corrected to 61.8% Fibonacci retracement, but it stopped rallying approximately when the USD Index started to rally, and the general stock market accelerated its decline. This time the rally was not as volatile, so the lower – 50% Fibonacci retracement level will hold the rally in check.
Taking into consideration that the general stock market has probably just topped, and the USD Index is about to rally, then gold is likely to slide for the final time in the following weeks/months. Both above-mentioned markets support this bearish scenario and so do the self-similar patterns in terms of gold price itself.
Disclaimer: All essays, research and information found on the Website represent the analyses and opinions of Mr. Radomski and Sunshine Profits' associates only. As such, it may prove wrong ...
more

