
USD Immune To Jump In Oil As FOMC Nears
The USD index has rebounded strongly from a key support area. The printing of a bullish outside day candle in the index breaking through the baseline on the daily with a pick up in aggregate tick volume is a sign that the uptrend may look technically ready to resume as traders prepare for the FOMC on Wed, which will act as the major driver to reassess the directional bias of the USD.
Quick Take
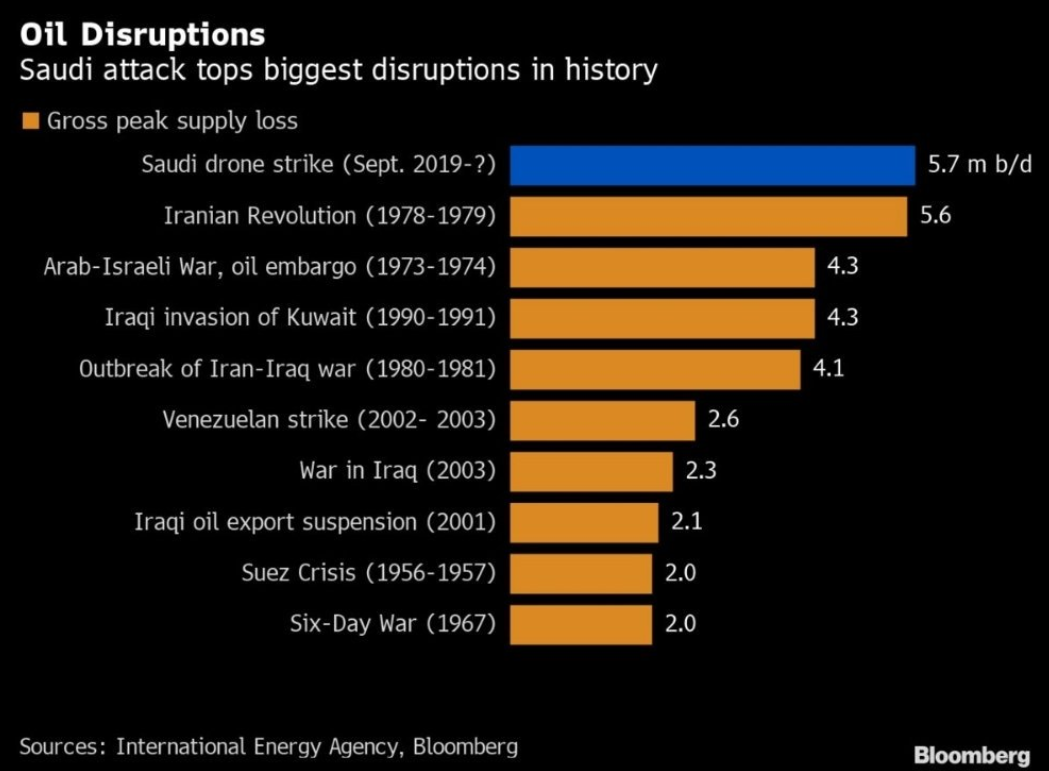
It was a very busy Monday for Oil traders as the market digested the news emanating from Saudi Arabia after suffering the sudden loss of 5.7m b/d of oil production, which marks the largest outage the market has ever seen in volume terms, surpassing the level from the Iraqi and Kuwaiti 1990 Gulf War. The CAD, NOK, but also a firm USD, were the outperformers while currencies the likes of the Euro of the Kiwi were punished the most. The market continues to be glued to any relevant update from Saudi Aramco that may clear up the key question mark to set Oil fair valuation, now heavily dependable on how fast can the Saudi restore its Oil output back to full capacity. Note, in line with the rather benign risk environment prior to the events in Saudi Arabia, do not mistake the attack as an admission that the forex environment should turn more risk-averse as the preponderance of technical evidence is not yet there, neither in equities, fixed income or in the performance of the JPY or CHF, with most of the safe-haven bids at the open of Asian markets in the latter two rapidly evaporating as the day rolled along. Currency traders will have to soon be expanding its focus as a line-up of Central Banks comes up, with most of the attention placed in the FOMC. It is precisely this high-impact event that may have helped to keep the USD bid off a critical support in the index, as the market is at risk of a less dovish forward guidance tone by the Fed amid firmer US fundamentals and the US-China trade war justifying extra patience, even if that view may now be challenged if we see an increase in geopolitical risks in the Middle East. An underpinning factor for the re-emergence of the USD buying interest is the development in the funding market, where we saw a massive jump in 3-month FRA/OIS spread (3m LIBOR vs overnight index swaps), which implies a spike in USD demand in the system.

The indices show the performance of a particular currency vs G8 FX. An educational article about how to build your own currency meter can be found in the Global Prime's Research section.
Narratives In Financial Markets
* The Information is gathered after scanning top publications including the FT, WSJ, Reuters, Bloomberg, ForexLive, Institutional Bank Research reports.
Action in Oil price not seen in a decade: Oil managed to maintain a high premium price on the aftermath of the attacks to the world’s biggest crude production facility in Abqaiq and Saudi Arabia’s second-biggest production facility in Khurais. It was the largest one day gain in a decade, that’s how relevant the news were. At one point during the Asian session, Brent Crude had jumped over 20 percent, which was a move not seen since the invasion of Kuwait in 1990.
Largest outage the market ever suffered: As Javier Blas, Chief Energy Correspondent at Bloomberg News, illustrates in a chart via Twitter: “The sudden loss of 5.7m b/d of oil production is the single largest outage the market has ever suffered (larger in volume than the loss of Iraqi and Kuwaiti output in the 1990 Gulf War, and the loss of Iranian oil in the 1979 Islamic Revolution)”
All fingers point at Iran: US has gathered further intelligence to validate its assumption that the oil attacks were launched by Iran, according to the WSJ, which notes “American officials say intelligence indicates that Iran was the staging ground for a debilitating attack on Saudi Arabia’s oil industry, and have shared the information with Saudi Arabia as both countries weigh retaliatory strikes”.
Almost half the oil production back online: According to a report doing the rounds by Energy Intelligence, Saudi Arabia has resumed over 40% of its total production capacity by now and rest could be back by month-end. If this gets confirmed by official sources, which it hasn’t, it would be a negative input for Oil. "Industry sources told Energy Intelligence that 40% of the lost production had already been restored by Monday, while one source said national oil company Saudi Aramco expects most of the rest -- more than 3 million b/d -- to be brought back online by the end of September." The report adds that “Aramco would seek to keep up oil deliveries by drawing down oil it holds in storage, while also offering crude grade swaps and maximizing output from its offshore fields."
The full extent of the damage unclear: Outside the inner circles of Saudi Aramco, nobody really knows how long it will take to restore Abqaiq’s oil output and how impactful it can be for the global oil supply. To prove this point, while the above report from Energy Intelligence speculates at a partial outage of one month, there are conflicting reports out there that note Saudi Aramco's full return to normal oil production volumes 'may take months', according to Reuters, citing two sources familiar with the situation.
Pessimism around Oil output recovery: Bloomberg carried an update titled “Aramco Less Optimistic on Pace of Oil Output Recovery”, in which it cited a person with knowledge of the matter as saying that “Saudi Aramco officials are growing less optimistic that there will be a rapid recovery in oil production after the attack on the giant Abqaiq processing plant.” The key is now to find out how fast Saudi Arabia can recover from this devastating strike, either through repairs, bypasses or increasing output via its offshore fields in the Persian Gulf. As Bloomberg adds “initially, it was said that significant volumes of crude could be flowing again within days, but it may now take longer than previously thought to resume operations at the plant, the person said, asking not to be named before an official announcement."
Brent forwards curve pricing in protracted supply disruption: Interestingly, in a comment I grabbed from Strategists at NAB, “the Brent forwards curve is suggesting prices are only likely to head back towards levels seen last Friday around August next year.” It means that so far the market is pricing in a protracted disruption in Oil supply.
Trump shares concerns towards Iran in Twitter: Trump said “it is looking like Iran was responsible for attacks on Saudi Arabia”, adding that “he doesn't want war with anyone but the US is prepared”, which appears to be an admission that the US is likely not going to get involved in any more external war conflicts, even if during the weekend, Trump threatened a military response (“locked and loaded”) depending on who is to blame for the attacks on Saudi Arabia’s oil supply. “US has a lot of options but he's not looking at options yet” Trump added in his tweet. The increase in oil prices also accounts for a geopolitical risk premium in case Saudi Arabia retaliates militarily.
So does the US secretary of energy... The US secretary of energy, Rick Perry, spoke in Vienna, pointing the finger at Iran as the culprits behind the attacked Saudi Oil refinery. Perry said “Iran must be held responsible” as “the attack on Saudi Arabia was an attack on the world energy system.” The headlines reinforce the notion that any recess in the Middle East tensions won’t be resolved anytime soon. The statement is congruent with a report by ABC, citing a senior Trump administration as saying that “Iran launched nearly a dozen cruise missiles” and “over 20 drones from its territory.”
Iran plays with fire: Iran's President Rouhani is playing a dangerous game by reportedly not condemning the attack but rather state “it was a reciprocal response to aggression against Yemen.” It is up for debate if the comment was taken out of context. Nonetheless, algo activity can get easily triggered on these type of ambiguous headlines.
NOK, CAD outperform in FX: In terms of currency performance, the equity market both in Europe and the US held up fairly well with energy and defensive sectors outperforming amid the rise in Oil and geopolitical risks. The Oil-sensitive currencies the likes of the NOK and CAD were the G10 top performers while the JPY failed to attract enough buy-side pressure in a sign safe-haven flows were rather absent.
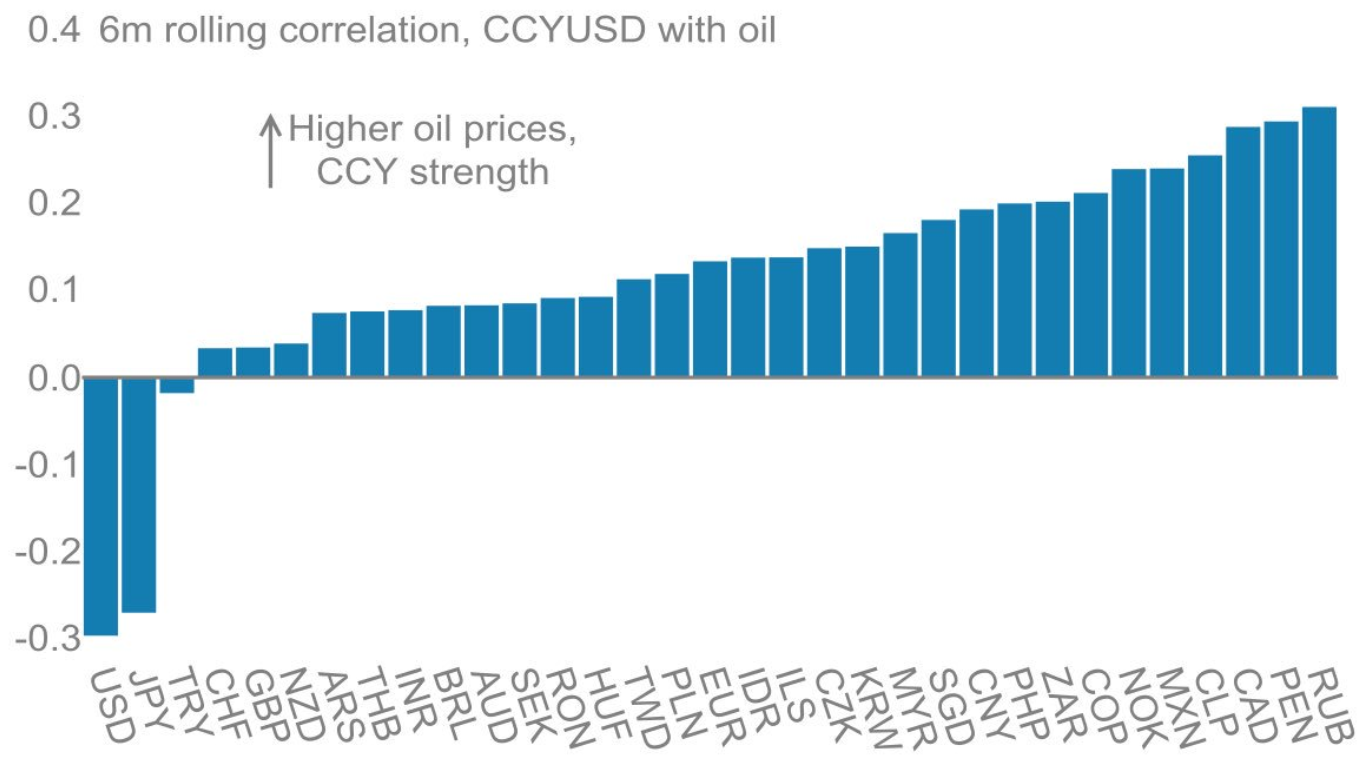
The USD deserves its own paragraph: The currency held very firm despite the correlation against a rising Oil tends to be negative as the chart below shows. However, there are quite a few moving pieces this week, most notably the building of expectations that the FOMC may strike a less dovish forward guidance tone as US fundamentals and the trade war justify extra patience, even if that view may now be challenged if we see an increase in geopolitical risks in the Middle East. The implied probability of a cut continues to be 100%. There are 2 cuts left priced for this year. Another positive USD development was the jump in 3-month FRA/OIS spread (3m libor vs overnight index swaps), which implies a spike in USD demand in the system.
The risk appetite has not gone away: The RORO (risk on, risk off) profile, after scanning multitude of risk-sensitive charts, remains constructive in the grand scheme of things, with the ramifications of the Saudi attack not causing much damage to sentiment. Remember, one of the overarching drivers of financial markets outside the movements in Oil remains the reduction of risk premia in safe-haven currencies due to the temporary positive narrative around US-China trade talks, the standby phase we find ourselves in Brexit, alongside a recess in HK protests and Italian political risks.

RBA minutes skewed towards the dovish side: A rather dovish outcome in today's RBA minutes. There was no real surprise but rather the confirmation that the RBA is going to be lower for longer. In the last paragraph, the reference to "accumulation of additional evidence" was dropped as the Central Bank focused on international as well as domestic conditions, most of all the labor market. Its forecasts seem to imply further easing will be necessary to support growth.

No new updates to the EU-UK Brexit deadlock: EC President Juncker said the Brexit talks with Johnson “were good” with familiar demands by Europe once again brought to the surface. Juncker said that “any solution must be compatible with the withdrawal agreement”, adding that there is “underlined EU willingness to examine proposals to meet objectives of backstop.” Meanwhile, it’s been reported that so far Johnson has not offered a solution or a proposal to the backstop that may help kickstart negotiations. The Johnson’s office issued a full statement about the meeting, found below:

Recent Economic Indicators & Events Ahead

Source: Forexfactory
A Dive Into The Charts

The indices show the performance of a particular currency vs G8 FX. An educational article about how to build your own currency meter can be found in the Global Prime's Research section.
The EUR index, as warned in my daily notes since the aftermath of the ECB, would find it very challenging to extend its gains given the overextended nature of the move from the ECB-induced bottom to the extreme top found. The rejection occurred at a critical intersection as depicted by the 3 touches of a descending trendline, which is the region causing the EUR index to now confirming a transition into negative territory as the price breaks the baseline with a marginal increase in aggregate tick volume. Just note, the index is now sitting at an area that may attract decent bids as it coincides with a sequence of daily closes from last week.
The GBP index has been unable to find sufficient demand after the staggering rise from last Friday, which is more often than not going to lead to an unwinding of longs before these regroup at better price levels to potentially resume the strong upside momentum. There is still significant room for the Sterling to correct lower before the currency enters what I’d consider attractive levels to re-engage in long-side exposure. Anything is possible when trading the Sterling these days as it’s become a highly sensitive currency to Brexit-related algo trading, with most of the opportunities being found intraday based on the newsflows. The fact that the GBP playbook can change in a heartbeat makes it incredibly risky to play it in long time horizons with the same level of conviction you’d have if trading other currencies where one can more easily pinpoint when the high-impact news may come about.
The USD index has rebounded strongly from a level of support I promoted in yesterday’s note as a clear candidate to act as a technical springboard. The printing of a bullish outside day candle breaking through the baseline on the daily with a pick up in aggregate tick volume is a sign that the uptrend may look ready to resume, although an important consideration to bear in mind is the high-impact FOMC decision on Wednesday, which can easily shake out weak-handed players as it will act as a major driver to reassess the directional bias of the USD. At this point, my interpretation of the USD behavior is that the market may be starting to prepare for a hawkish rate cut by the Fed, which would be quite congruent with the recent fundamental developments.
The CAD index is definitely holding a reinvigorated outlook courtesy of the ‘eye-popping’ rise in the price of Crude Oil. The technical picture in the chart, as a reflection of the overall sentiment in the currency, is looking more positive as the price recovered the baseline on higher tick volume despite the fact that based on the cycle maturity of the index, which is interpreted through the fisher transform indicator, it suggests a follow-through continuation right off the gates is a tall order before a possible retracement. Price doesn’t tend to go up in a straight line, but again, the Oil vol can cause this market to keep showing outlier movements near term.
The NZD index has resumed its bearish tendencies and is looking increasingly likely that the currency will remain under pressure for the time being as there is no technical levels in the proximity to lean against for the disheartened bulls before a retest of the recent lows. Note, the circled area in the chart, which was a clear resistance level, that’s where the trend has re-initiated from after the print of a sizeable upper shadow candle. The market has certainly punished the Kiwi more than any other currency in the last quarter and is not looking good for the interest of buyers with a notable absence of technical backing.
The AUD index keeps testing what in theory, technically speaking, should be a very tough area to crack as the resistance line reaches is very significant as per the swing low back in early July. As I’ve reiterated on several occasions, the AUD trend looks overcooked after more than 2 weeks of climbs in a row, suggesting that the maturity of its upcycle may have reached exhaustion, which one could interpret the premise as true by analyzing the tapering pattern of the aggregate tick volume with participation below the average. I wouldn’t discard a retest of the baseline before continuing into higher levels.
The JPY index continues to trade under a bearish context with no technical evidence to get much encouragement if one is to consider longs in the safe haven currency of choice. The fact that the Saudi attack has failed to promote a higher JPY on a daily close basis, with most of the early gains in Asia evaporating by the end of the day, should be a communication of the absence of interest. Remember, this week we have the outcome of the BOJ, which is going to have an impact on the volatility of the currency, even if no fireworks are expected from the central bank. Overall, the outlook for the JPY looks quite bearish in the short term.
The CHF index found an excess of supply off the reliable daily baseline level, with the index rejecting the level quite sharply. I’ve been projecting lower levels in the CHF predicated on the fact that the ongoing down leg has not yet reaches its full 100% expected extension. This assumption will continue to hold true until there is a violation of the bearish structure, which so far is not the case, hence why I continue to endorse the short bias as the base case here. A retake of the baseline to the upside will be a warning sign that will undermine the technicals, although it will have to be assessed from a holistic standpoint, looking at volume, indicators and fundamentals. Note, the SNB also meets this week, which will influence the CHF trading.
Important Footnotes
- Risk model: The fact that financial markets have become so intertwined and dynamic makes it essential to stay constantly in tune with market conditions and adapt to new environments. This prop model will assist you to gauge the context that you are trading so that you can significantly reduce the downside risks. To understand the principles applied in the assessment of this model, refer to the tutorial How to Unpack Risk Sentiment Profiles
- Cycles: Markets evolve in cycles followed by a period of distribution and/or accumulation. To understand the principles applied in the assessment of cycles, refer to the tutorial How To Read Market Structures In Forex
- POC: It refers to the point of control. It represents the areas of most interest by trading volume and should act as walls of bids/offers that may result in price reversals. The volume profile analysis tracks trading activity over a specified time period at specified price levels. The study reveals the constant evolution of the market auction process. If you wish to find out more about the importance of the POC, refer to the tutorial How to Read Volume Profile Structures
- Tick Volume: Price updates activity provides great insights into the actual buy or sell-side commitment to be engaged into a specific directional movement. Studies validate that price updates (tick volume) are highly correlated to actual traded volume, with the correlation being very high, when looking at hourly data. If you wish to find out more about the importance tick volume, refer to the tutorial on Why Is Tick Volume Important To Monitor?
- Horizontal Support/Resistance: Unlike levels of dynamic support or resistance or more subjective measurements such as fibonacci retracements, pivot points, trendlines, or other forms of reactive areas, the horizontal lines of support and resistance are universal concepts used by the majority of market participants. It, therefore, makes the areas the most widely followed and relevant to monitor. The Ultimate Guide To Identify Areas Of High Interest In Any Market
- Trendlines: Besides the horizontal lines, trendlines are helpful as a visual representation of the trend. The trendlines are drawn respecting a series of rules that determine the validation of a new cycle being created. Therefore, these trendline drawn in the chart hinge to a certain interpretation of market structures.
- Correlations: Each forex pair has a series of highly correlated assets to assess valuations. This type of study is called inter-market analysis and it involves scoping out anomalies in the ever-evolving global interconnectivity between equities, bonds, currencies, and commodities. If you would like to understand more about this concept, refer to the tutorial How Divergence In Correlated Assets Can Help You Add An Edge.
- Fundamentals: It’s important to highlight that the daily market outlook provided in this report is subject to the impact of the fundamental news. Any unexpected news may cause the price to behave erratically in the short term.
- Projection Targets: The usefulness of the 100% projection resides in the symmetry and harmonic relationships of market cycles. By drawing a 100% projection, you can anticipate the area in the chart where some type of pause and potential reversals in price is likely to occur, due to 1. The side in control of the cycle takes profits 2. Counter-trend positions are added by contrarian players 3. These are price points where limit orders are set by market-makers. You can find out more by reading the tutorial on The Magical 100% Fibonacci Projection
The Daily Edge is authored by Ivan Delgado, Head of Market Research at Global Prime. The purpose of this content is to provide an assessment of the market conditions. The report takes an in-depth ...
more

