
US Dollar Cycle Points To New All-Time Highs For Gold
The US Dollar index is not a true measure of value of the US dollar. It just tracks an “exchange rate” between the US dollar and a basket of significant fiat currencies.
For a true measure of value of the US dollar, it is better to look to Gold and Silver. However, there is a relationship between significant Gold rallies and the US Dollar index.
Gold has a tendency to rally at a certain time in a US Dollar index long-term cycle. Previously, I have looked at significant Silver rallies, relative to the US Dollar long-term cycle. Here, I would like to look at Gold.
Here is a long-term chart of the US Dollar index:

On the chart, I have marked two fractals (1 to 5). Both fractals exist in similar conditions – relative to the relevant Dow/Gold ratio peaks (1966 and 1999). During the period from Points 1 to 3 on both charts, the first phase of the Gold bull market occurred (70s Gold bull market 1971 to 1980 and current Gold bull market 1999 to 2011).
During the period from points 3 to 4, Gold started a significant correction (1974 and 2011), and bottomed years later (1976 and 2015). At point 4, the Dow peaked (1976 and 2020 – true if Feb 2020 is Dow top).
Another important thing that happened during both these periods, was Gold being much stronger than Silver. This was especially more pronounced during the current pattern period since the Dollar was much stronger during the current Gold and Silver correction (from 2011) than during the one, from the mid-70s.
Below, is the same chart, with the Gold chart included for reference purposes:
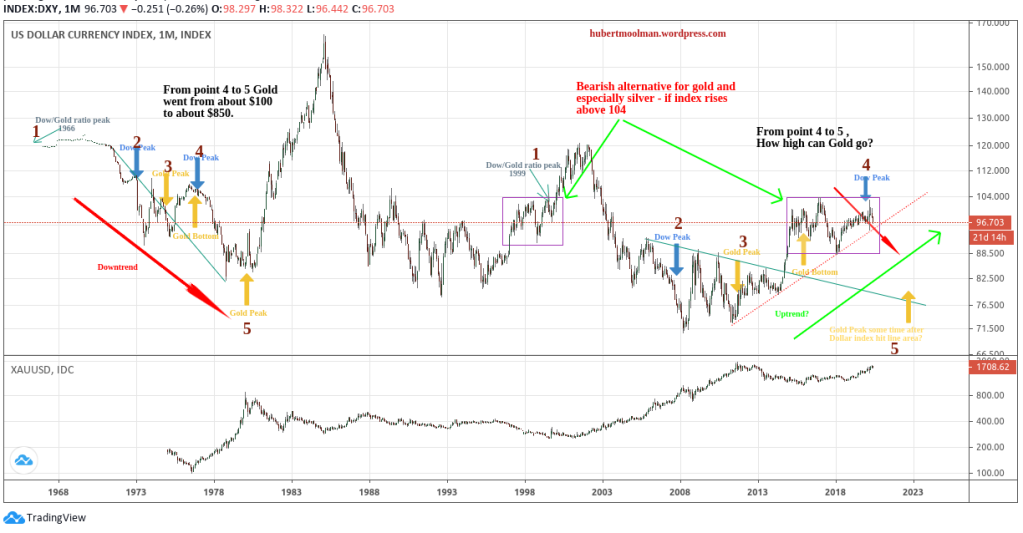
Notice that the 1980 and 2011 Gold tops came close to the end of a downtrend of the US Dollar index. Also, it came just after the US Dollar index made new all-time lows in 1978 and 2008.
This is what I would be looking for at before the next Gold peak. If not a new all-time low for the US Dollar index, then at least a decent downtrend before calling a potential Gold peak.
If the current pattern continues to follow the 70s pattern, then the US Dollar index is likely to decline significantly over the coming months and years, while Gold makes new all-time highs.
During the period from point 4 to 5 (in the 70s pattern), Gold went from about $100 to $850. How high can Gold go this time?
For more on this and this kind o fractal analysis, you are welcome to subscribe to my premium service. I have also ...
more

