
Us Crude Supplies At 35-Month Low; Total Oil And Product Supplies At 6 1/2-Year Low
US oil data from the US Energy Information Administration for the week ended Sept. 17 indicated that, despite sizable increases in our oilfield production and our oil imports, we still needed to withdraw oil from our stored commercial crude supplies for the seventh consecutive week, and for the 33rd time in the past 44 weeks.
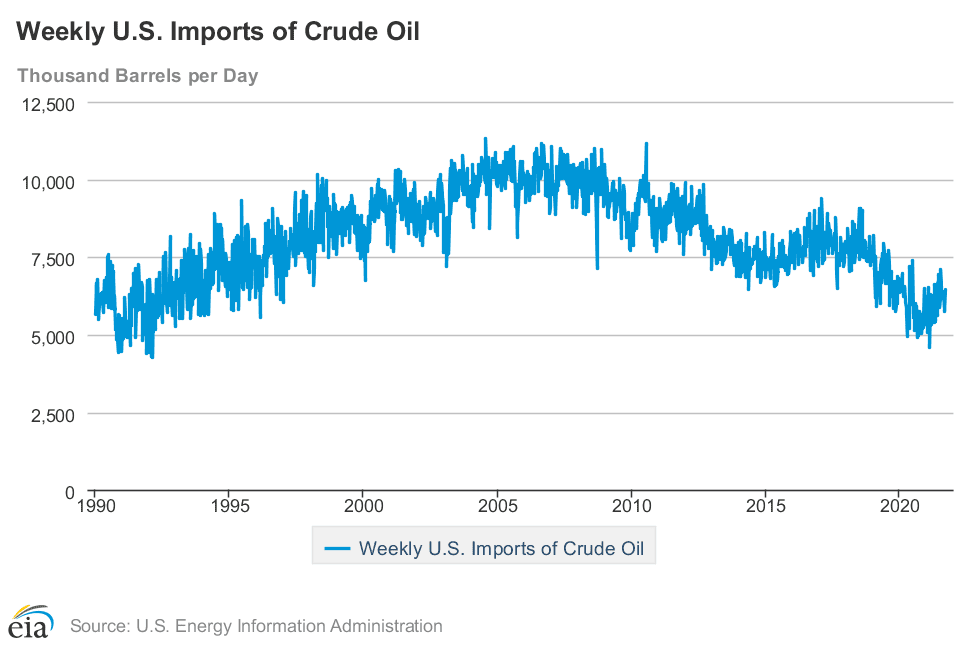
Our imports of crude oil rose by an average of 704,000 barrels per day to an average of 6,465,000 barrels per day, after falling by an average of 44,000 barrels per day during the prior week.
Meanwhile, our exports of crude oil rose by an average of 185,000 barrels per day to an average of 2,809,000 barrels per day during the week, which meant that our effective trade in oil worked out to a net import average of 3,656,000 barrels of per day during the week ended Sept. 17. This is 519,000 more barrels per day than the net of our imports minus our exports during the prior week.
Over the same period, the production of crude oil from US wells was reportedly 500,000 barrels per day higher at 10,600,000 barrels per day, and hence our daily supply of oil from the net of our international trade in oil and from domestic well production appears to total an average of 14,265,000 barrels per day during the week.
US oil refineries reported they were processing an average of 15,347,000 barrels of crude per day during the week ended Sept. 17. This is 960,000 more barrels per day than the amount of oil they processed during the prior week. While over the same period, the EIA’s surveys indicated that an average of 669,000 barrels of oil per day were being pulled out of the supplies of oil stored in the US.
Based on reported & estimated data, this week’s crude oil figures from the EIA appear to indicate our total working supply of oil from net imports, from storage, and from oilfield production was 422,000 barrels per day less than what our oil refineries reported they used during the week.
To account for that disparity between the apparent supply of oil and the apparent disposition of it, the EIA just plugged a (+422,000) barrel per day figure onto line 13 of the weekly U.S. Petroleum Balance Sheet to make the reported data for the daily supply of oil and the consumption of it balance out -- essentially a fudged factor they label in their footnotes as “unaccounted for crude oil.”
This suggests there must have been an error or omission of magnitude in this week’s oil supply & demand figures we have just transcribed. However, since most everyone treats these weekly EIA reports as gospel and these figures often drive oil pricing and decisions to drill or complete wells, we’ll continue to report them as they’re published.
Additional details from the weekly Petroleum Status Report (pdf) indicate the four-week average of our oil imports rose to an average of 6,094,000 barrels per day last week, which was 18.9% more than the 5,125,000 barrel per day average that we were importing over the same four-week period last year.
The 669,000 barrel per day net decrease in our crude inventories included 497,000 barrels per day that were pulled out of our commercially available stocks of crude oil, and 172,000 barrels per day of oil that had been stored in our Strategic Petroleum Reserve as part of an emergency loan of oil to Exxon in the wake of hurricane Ida.
This week’s crude oil production was reported to be 500,000 barrels per day higher at 10,600,000 barrels per day. This is because the EIA's rounded estimate of the output from wells in the lower 48 states was 500,000 barrels per day higher at 10,200,000 barrels per day, while a 8,000 barrel per day increase in Alaska’s oil production to 429,000 barrels per day had no impact on the reported rounded national production total.
US crude oil production had hit a pre-pandemic record high of 13,100,000 barrels per day during the week ending March 13, 2020, so this week’s reported oil production figure was 19.1% below that of our pre-pandemic production peak, but still 25.8% above the interim low of 8,428,000 barrels per day that US oil production had fallen to during the last week of June of 2016.
Meanwhile, US oil refineries were operating at 87.5% of their capacity while using those 15,347,000 barrels of crude per day during the week ended Sept. 10, up from 82.1% of capacity the prior week, but still a bit below normal utilization for early autumn refinery operations.
Meanwhile, the 15,347,000 barrels per day of oil that were refined this week were 14.8% more barrels than the 13,370,000 barrels of crude that were being processed daily during the pandemic-impacted week ended Sept. 18 of last year. They were 7.1% below the 16,513,000 barrels of crude that were being processed daily during the week ended Sept. 20, 2019, when US refineries were operating at what was then a near normal 89.8% of capacity.
With this week’s increase in the amount of oil being refined, the gasoline output from our refineries was also higher, increasing by 372,000 barrels per day to 9,643,000 barrels per day during the week ended Sept. 17, after our gasoline output had decreased by 851,000 barrels per day over the prior week.
Meanwhile, this week’s gasoline production was 3.5% higher than the 9,315,000 barrels of gasoline that were being produced daily over the same week of last year, it was 5.8% lower than the gasoline production of 10,240,000 barrels per day during the week ending Sept. 20, 2019. At the same time, our refineries’ production of distillate fuels (diesel fuel and heat oil) increased by 298,000 barrels per day to 4,454,000 barrels per day.
This is after our distillates output had decreased by 29,000 barrels per day over the prior week. But even after this week’s increase, our distillates output was a bit less than the 4,470,000 barrels of distillates that were being produced daily during the week ended Sept. 18, 2020, and 10.9% below the 5,000,000 barrels of distillates that were being produced daily during the week ended Sept. 20, 2019.
With the big increase in our gasoline production, our supply of gasoline in storage at the end of the week increased for the tenth time in 24 weeks, and for the nineteenth time in 44 weeks, rising by 3,474,000 barrels to 221,616,000 barrels during the week ending Sept. 17. Our gasoline supplies increased this week, though the amount of gasoline supplied to US users rose by 4,000 barrels per day to 8,896,000 barrels per day.
This is because our imports of gasoline rose by 444,000 barrels per day to 1,082,000 barrels per day, while our exports of gasoline fell by 13,000 barrels per day to 621,000 barrels per day. Even after this week’s inventory increase, our gasoline supplies were 2.6% lower than last Sept. 18’s gasoline inventories of 227,499,000 barrels, and about 3% below the five-year average of our gasoline supplies for this time of the year.
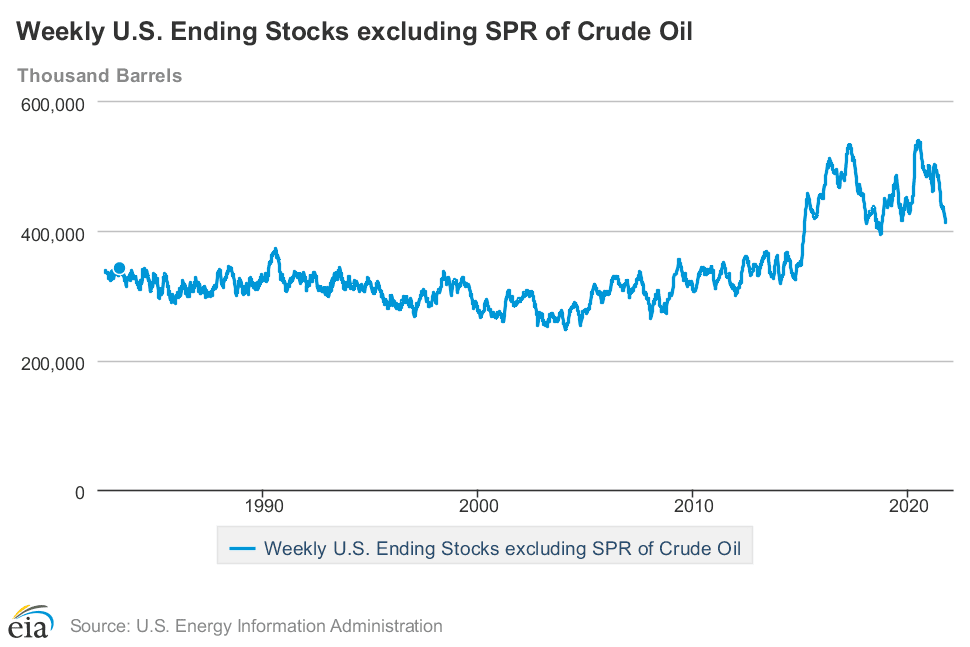
With oil refining recovering from Hurricane Ida faster than our oil production has, our commercial supplies of crude oil in storage fell for the sixteenth time in 18 weeks and for the thirty-sixth time in the past year, decreasing by 3,481,000 barrels over the week, from 417,445,000 barrels to a 35-month low of 413,964,000 barrels.
Finally, with our inventory of crude oil and and our supplies of all products made from oil, we’re also going to check the total of all U.S. Stocks of Crude Oil and Petroleum Products, including those in the SPR. We find total inventories, including those in the Strategic Petroleum Reserve and those held by the oil industry, down by 3,788,000 barrels this week, from 1,845,415,000 barrels on Sept. 10 to 1,841,627,000 barrels on Sept. 17, which is the lowest since March 6, 2015, and is thus a six and a half-year low.


